Chesapeake Bay Climate Adaptation Toolbox
Headwaters Economics Neighborhoods at Risk
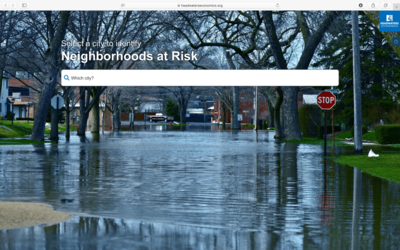
Developed By: Headwater Economics
Summary: The Headwaters Economics Neighborhoods at Risk tool uses an interactive map to display characteristics of potentially vulnerable neighborhoods in 27 U.S. cities.
This easy-to-use tool is designed to help conduct vulnerability assessments and prioritize capital improvements. Using the interactive map, or simple slider bars, users can determine what percent of the population within each census tract, meets selected indicators of hardship, race, or age. This tool also indicates what percent of each census tract are in the 500-yr floodplain as well as percent impervious surface and area lacking tree canopy. In addition to census tract data, this tool also includes a sidebar displaying climate change projections for two emissions scenarios. This tool provides a great summary of vulnerability and some climate data, however at this time it is only available for a few cities.
Get This Tool: https://headwaterseconomics.org/equity/climate-change/neighborhoods-at-risk/
Geographic Coverage
- Contiguous United States
Tags
- Climate projections
- Jursidiction based
- City level
- County level
- Computer application
- Interactive interface/map
- Compare scenarios/locations
- Downloadable results
Cost
- Free
Skill Level
- Low