Chesapeake Bay Climate Adaptation Toolbox
Climate Impact Map
Developed By: Climate Impact Lab
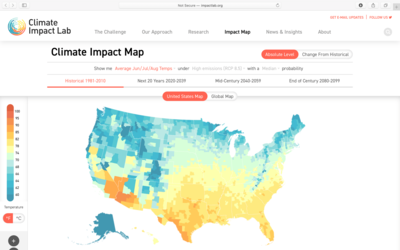
Summary: The Climate Impact Map is an interactive mapping tool that displays historical and projected changes in future temperature in the United States and across the globe.
With both a US and global map view, this tool allows users to visualize the potential impact of various emissions scenarios on national and global temperatures by the end of the century. Using the interactive map, users can display a variety of temperature metrics including annual and seasonal averages, as well as days below freezing and above 95 degrees F. For each metric, users can view historical data (1986-2005) or future projections at three time-steps (next 20 years, mid-century, and end of century). Future projections are available for high (RCP 8.5), low (RCP 4.5), and moderate (RCP 2.5) emissions scenarios. By default, this tool will display the median probability projections, however users can also view low and high probability projections. The option to select probability is a unique feature that allows users to better understand the likelihood of future climate conditions. This tool provides clear documentation of methodology, as well as an option to download data in an excel file. This tool covers a wide geographic range and therefore the downloaded data is generalized by state, rather than by county as illustrated in the map viewer.
Geographic Coverage
- Contiguous United States
Tags
- Historical
- Climate projections
- Jursidiction based
- County level
- State level
- Website
- Interactive interface/map
- Compare scenarios/locations
- Downloadable data
Cost
- Free
Skill Level
- Low