Chesapeake Bay Climate Adaptation Toolbox
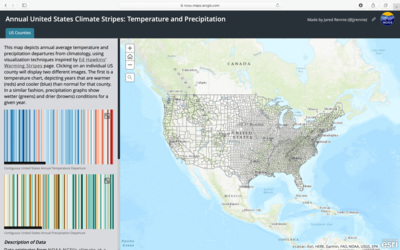
Annual United States Climate Stripes: Temperature and Precipitation
Developed By: North Carolina Institute for Climate Studies (NCICS)
Summary: The Annual United State Climate Stripes is a climate visualization tool designed to depict changes in temperature and precipitation through the United States.
Inspired by Ed Hawkin’s Warming Strips visualizations, this tool provides color-banded representations of temperature and precipitation anomalies for every county in the United State. This simple visualization tool provides an unique artistic approach to examine historical changes in local climate data, dating back to 1895. Within the tool, users can find basic explanations of the data and visualizations, as well as links to supporting information.
Get This Tool: https://ncsu.maps.arcgis.com/apps/MapSeries/index.html?appid=a414fcbe90fb4dedaab06a8abf12b1a0
Geographic Coverage
- Contiguous United States
Tags
- Historical
- Jursidiction based
- County level
- Computer application
- Interactive interface/map
- Downloadable results
Cost
- Free
Skill Level
- Low