Chesapeake Bay Climate Adaptation Toolbox
Potomac Inundation Maps
Developed By: District of Columbia Silver Jackets, U.S. Army Corps of Engineers (USACE), United States Geological Survey (USGS) Water Science Center for Maryland, Delaware, and DC, the National Weather Service (NWS), the National Park Service (NPS), the D.C. Department of Energy and the Environment (DC DOEE), the National Capital Planning Commission (NCPC), and representatives from D.C., Arlington, Fairfax, and Prince George’s Counties and the City of Alexandria
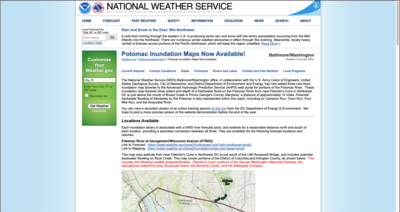
Summary: The Potomac Inundation Maps tool is composed of 3 separate inundation map interfaces which display the extent and depth of freshwater flooding for 3 locations on the Potomac River in Washington D.C.
This easy-to-use tool uses real time data in order to develop area specific readings of water levels, inundation levels, and flood categories. For each location, the tool includes a water level forecast and an inundation map. The water level forecasts utilize data from a nearby water level gauge to generate weekly plots of tidal height including observed water level over the past 5 days as well as a 3-day forecast. At each site, users can also view flood inundation maps for a variety of water levels ranging from minor flooding to well above the largest observed flood. Users can also view an approximation of the current flood extent based on the corresponding water level forecasts. Throughout the tool, users can access general information about a specific river gauge or create “River Reports” which allow users to view information for selected attributes and locations. However, data in this tool is not available for all areas and does not account for meteorological forces such as wind. Data can be viewed in a tabular format and are available for download in a variety of files.
Get This Tool: https://www.weather.gov/lwx/potomacinundationmaps
Geographic Coverage
- Washington, DC; Arlington County, VA; Alexandria City, VA; Fort Foote, MD; Fairfax County, VA; Prince George’s County, VA
Tags
- Real-time/Current
- Forecast
- Grid based
- Location specific
- Website
- Interactive interface/map
- Downloadable results
Cost
- Free
Skill Level
- Medium