Downscaled Data
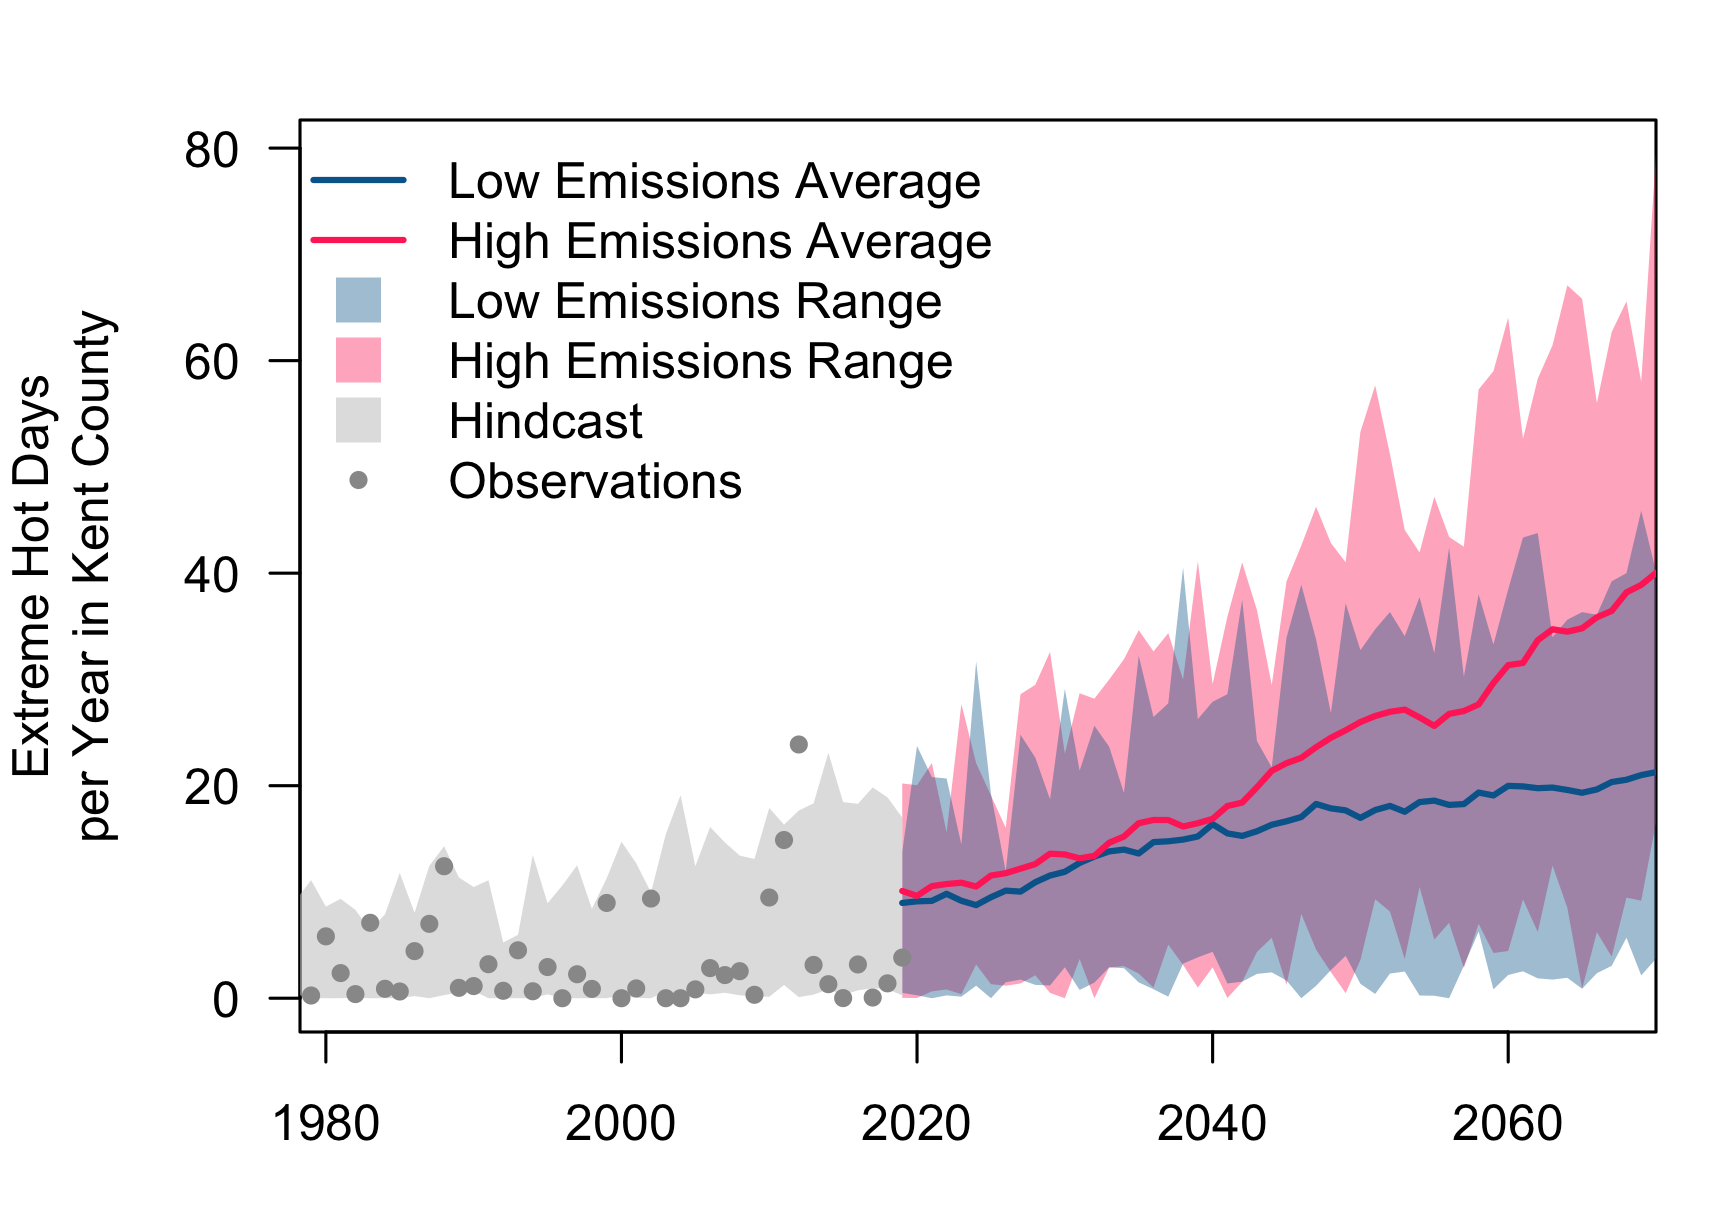
The Outlooks use downscaled global earth system model data over the historic period and projections.
Differences may exist between the underlying data sources, scenarios, or baseline periods used here and those used for other risk-reduction resources. As an example, this product uses downscaled projections from the MACAv2-METDATA dataset due to the larger number of available variables, improved performance for extreme precipitation, and more recent updates when compared with the LOCA dataset used by the U.S. National Climate Assessment. Users are advised that these choices may result in some differences in projected outcomes, particularly at the small spatial scales represented here.
For more information on the underlying data sources and scenarios used in the Outlooks, you can review the following pages:
| Data/ Quote | Reference |
|---|---|
| Recorded deaths from exposure to excessive natural heat by state | Centers for Disease Control and Prevention, National Center for Health Statistics. Underlying Cause of Death 1999-2019 on CDC WONDER Online Database, released in 2020. Data are from the Multiple Cause of Death Files, 1999-2019, as compiled from data provided by the 57 vital statistics jurisdictions through the Vital Statistics Cooperative Program. Retreived 10 Nov 2021 from http://wonder.cdc.gov/ucd-icd10.html |
| “Across the Mid-Atlantic, stream temperatures increased roughly 2.5 degrees F from 1960 to 2010.” | K.C. Rice and J.D. Jastram (2015). Rising air and stream-water temperatures in Chesapeake Bay region, USA. Climatic Change 128, 127–138. doi:10.1007/s10584-014-1295-9 |
| “In the US, electricity demand for cooling will increase by 5-20% per degree C.” | T. Wilbanks, V. Bhatt, D. Bilello, S. Bull, J. Ekmann, W. Horak, Y.J. Huang, M.D. Levine, M.J. Sale, D. Schmalzer, M.J. Scott (2008). Effects of Climate Change on Energy Production and Use in the United States. US Department of Energy Publications. 12. Retrieved from https://digitalcommons.unl.edu/usdoepub/12 |
| “At 95°F, it’s hard to keep indoor areas and our bodies cool.” | US Environmental Protection Agency (EPA) and Centers for Disease Control and Prevention (CDC) (2016). Climate Change and Extreme Heat: What You Can Do to Prepare. EPA 430-R-16-061. Retrieved from https://www.epa.gov/sites/default/files/2016-10/documents/extreme-heat-guidebook.pdf |
| “Ice cover on Lake Erie has decreased by 50% between 1973 and 2010.” | Wang, J., Bai, X., Hu, H., Clites, A., Colton, M., & Lofgren, B. (2012). Temporal and Spatial Variability of Great Lakes Ice Cover, 1973–2010, Journal of Climate, 25(4), 1318-1329. doi:10.1175/2011JCLI4066.1 |