Kent County, DE
Kent County residents will face increasingly severe weather-related hazards, such as heat waves, flooding, and storm surge.
As the frequency and intensity of local hazards change, it is important for all of us to protect communities and local habitats. Using the best data, scientists can project how long-term averages in daily weather will change in the future, and the effects this will have on localities.
Information on extreme weather and hazards can empower citizens, decision-makers, and other stakeholders to make infored risk-reduction decisions. With planning and preparation, Kent County can reduce risks for all residents.
Changing Temperature Patterns
Human health, wildlife, and infrastructure are all threatened by higher temperatures. At 95°F, it is hard to keep indoor areas and our bodies cool. Kent County’s summers are getting hotter. On average, Kent County sees 4 days per year with temperatures above 95°F (1990-2019 average). Within the next 50 years (by 2070), Kent County can expect a yearly average of 21 to 40 days above 95°F, with associated increases in cooling costs, reduced air quality, heat-related illnesses, and damage to runways and roads at Dover Air Force Base.
![]() HEAT-RELATED ILLNESSES: Heatwaves can kill people and pets, and can cause difficulty breathing, exhaustion, cramping, and heatstroke. Individuals at higher risk include children, pregnant women, older adults, outdoor workers, and lower-income residents.
HEAT-RELATED ILLNESSES: Heatwaves can kill people and pets, and can cause difficulty breathing, exhaustion, cramping, and heatstroke. Individuals at higher risk include children, pregnant women, older adults, outdoor workers, and lower-income residents.
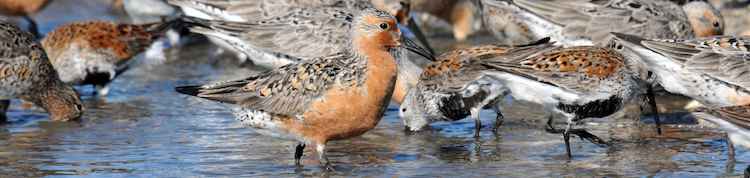
![]() DISRUPTED WILDLIFE: Every spring, shorebirds including the Red Knot pass through Kent county to feast on horseshoe crab eggs. As temperatures increase, warmer weather earlier in spring can cause horseshoe crabs to lay eggs earlier, leading shorebirds to miss out on key food for their migration.
DISRUPTED WILDLIFE: Every spring, shorebirds including the Red Knot pass through Kent county to feast on horseshoe crab eggs. As temperatures increase, warmer weather earlier in spring can cause horseshoe crabs to lay eggs earlier, leading shorebirds to miss out on key food for their migration.
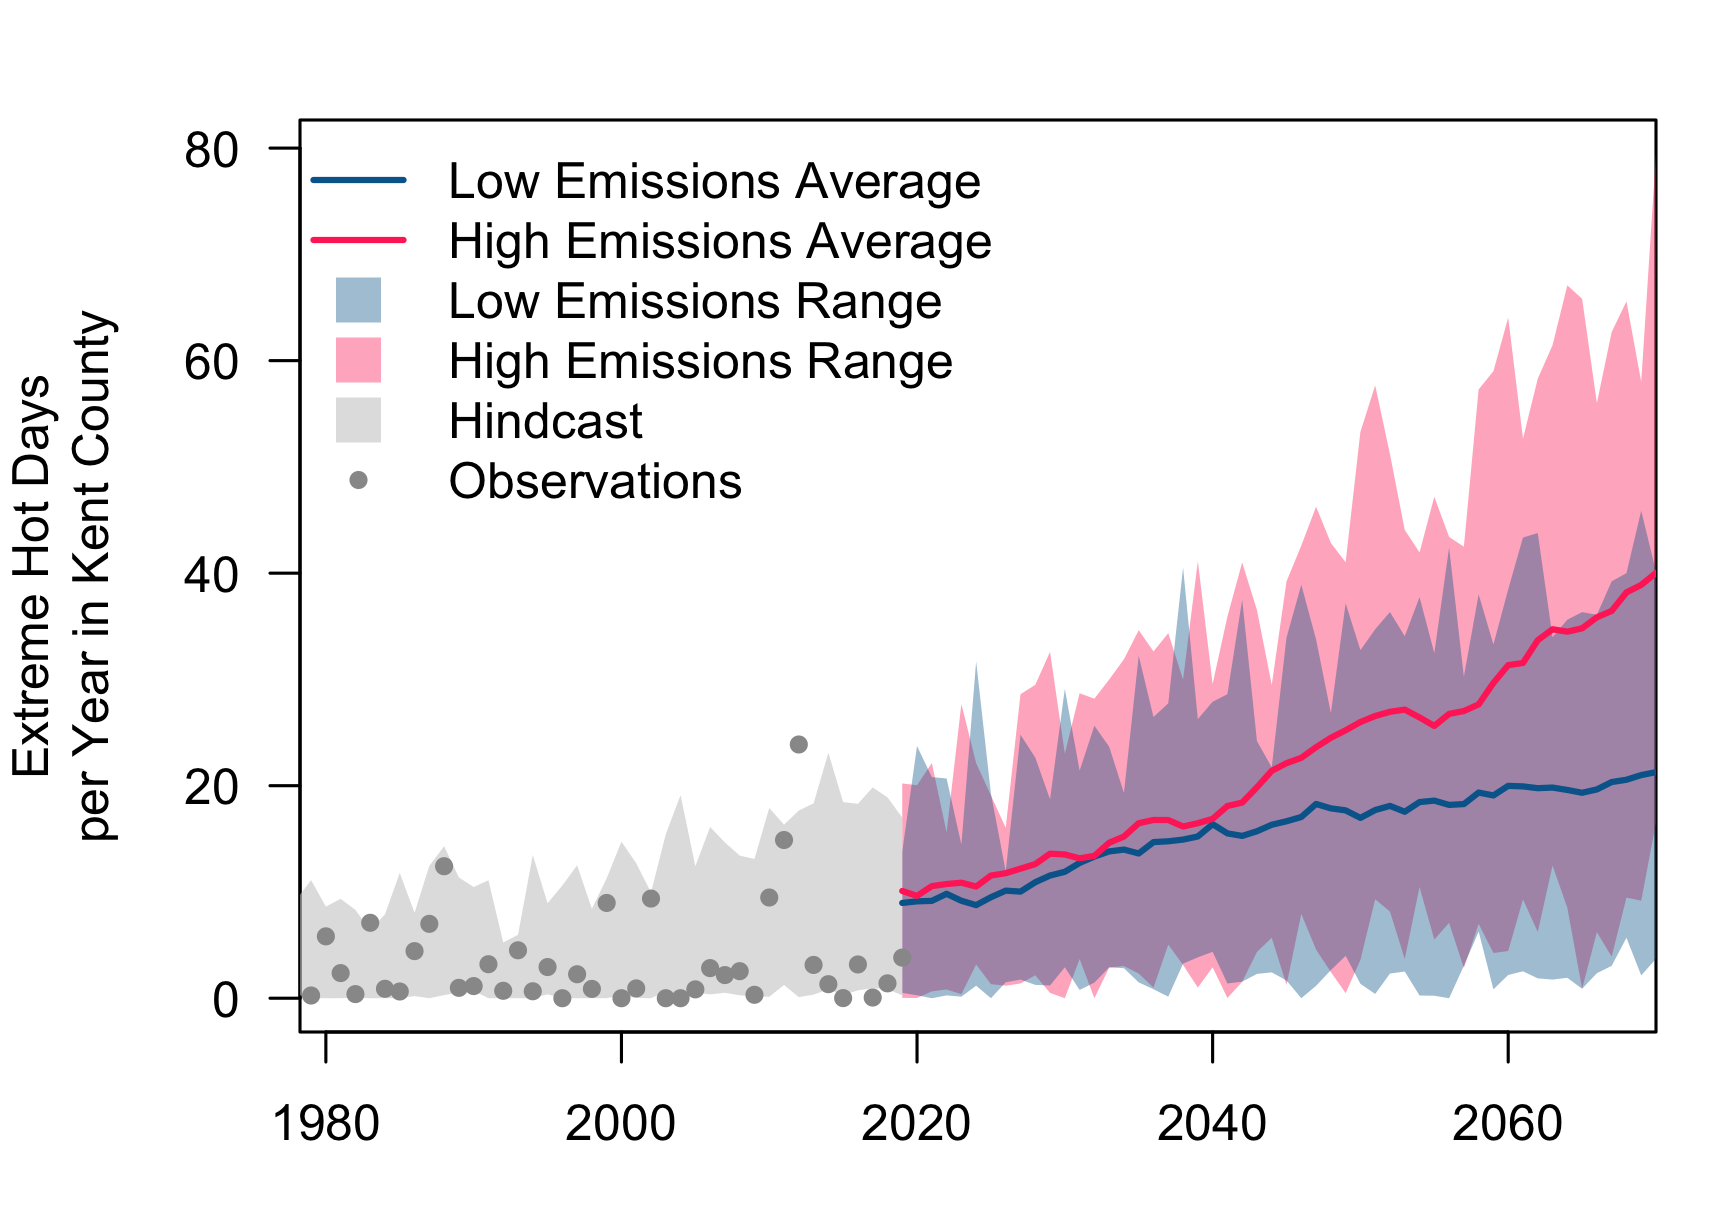
The graph shows the number of days in a year with temperatures above or equal to 95°F. Dots represent observed annual days of extreme temperatures and the gray shading shows the hindcast1. Two scenarios of the future are shown as a high-emissions scenario (RCP 8.5) in red and a low-emissions scenario (RCP 4.5) in blue. Data for the future scenarios are retrieved from Multivariate Adaptive Constructed Analogs (MACA), and observed data are from the Gridded Surface Meteorological Dataset (gridMET).
Changing Rainfall Patterns
Heavy rainfall in Kent County is increasing in frequency and intensity, causing property damage, septic backups, mold and indoor air quality issues, and impacts to water quality in wells, local streams, the Chesapeake and Delaware Bays. Annual rainfall in Kent County will likely increase by an average of 2 to 3 inches (2050-2079 average compared to the 1990-2019 average).
![]() FLOODING: Heavy rain overwhelms infrastructure and drainage systems, causing property damage and covering roads.
FLOODING: Heavy rain overwhelms infrastructure and drainage systems, causing property damage and covering roads.
![]() REDUCED HUMAN HEALTH: Rising water tables cause septic backups and groundwater pollution, putting Kent County’s drinking water at risk of contamination. Changing moisture levels impact the spread of illness, including tick- and mosquito-borne diseases as high humidity promote their activity.
REDUCED HUMAN HEALTH: Rising water tables cause septic backups and groundwater pollution, putting Kent County’s drinking water at risk of contamination. Changing moisture levels impact the spread of illness, including tick- and mosquito-borne diseases as high humidity promote their activity.
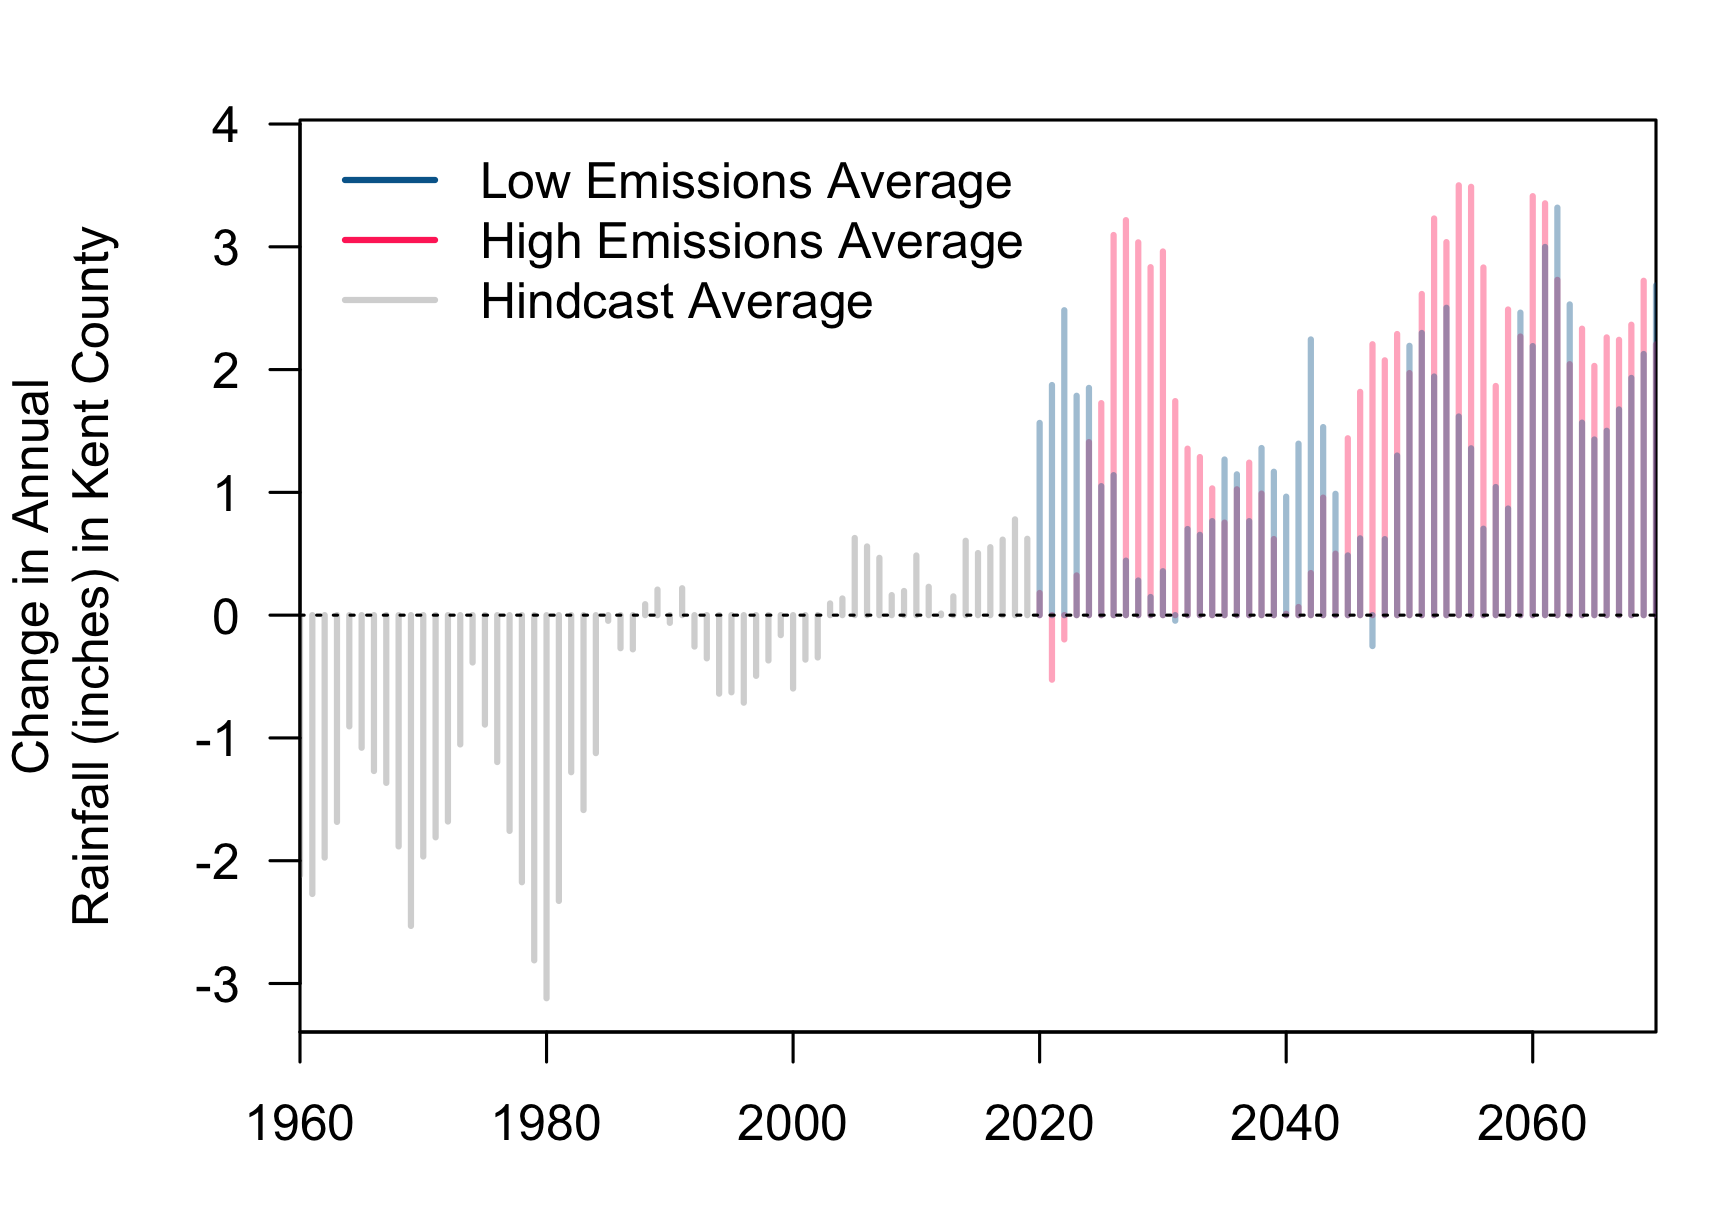
The graph shows the change in annual rainfall compared to the average between 1990 and 2019. The gray lines show the hindcast. Two scenarios of the future are shown as a high-emissions scenario (RCP 8.5) in red and a low-emissions scenario (RCP 4.5) in blue. Data for the future scenarios are retrieved from MACA.
Sea Level Rise
As temperatures warm, land ice melts and seawater expands causing sea levels to rise around the world and in Delaware Bay and Chesapeake Bay. Between 1960 and 2019, sea levels near Kent County rose roughly 0.8 feet leading to more frequent and severe coastal flooding, and property damage. Sea levels will rise an additional 0.7 to 2.6 feet in the next 50 years (by 2070), submerging property, destroying habitat for horseshoe crabs, and permanently reshaping Kent County’s coastline.
![]() FLOODING: Rising sea levels allow tides, waves, and severe flooding to push further inland. This causes more frequent high tide flooding and increases the impacts of storm surge, putting low-lying housing, commercial property, and infrastructure at risk.
FLOODING: Rising sea levels allow tides, waves, and severe flooding to push further inland. This causes more frequent high tide flooding and increases the impacts of storm surge, putting low-lying housing, commercial property, and infrastructure at risk.
![]() LOSS OF WETLANDS, FARMS, AND BEACHES: Wetlands, beaches, and dunes protect communities and infrastructure from coastal storms, support tourism, and provide unique habitats. Saltwater intrusion can alter wetland species and force farmers to abandon fields, and coastal erosion eats away the beaches and dunes.
LOSS OF WETLANDS, FARMS, AND BEACHES: Wetlands, beaches, and dunes protect communities and infrastructure from coastal storms, support tourism, and provide unique habitats. Saltwater intrusion can alter wetland species and force farmers to abandon fields, and coastal erosion eats away the beaches and dunes.
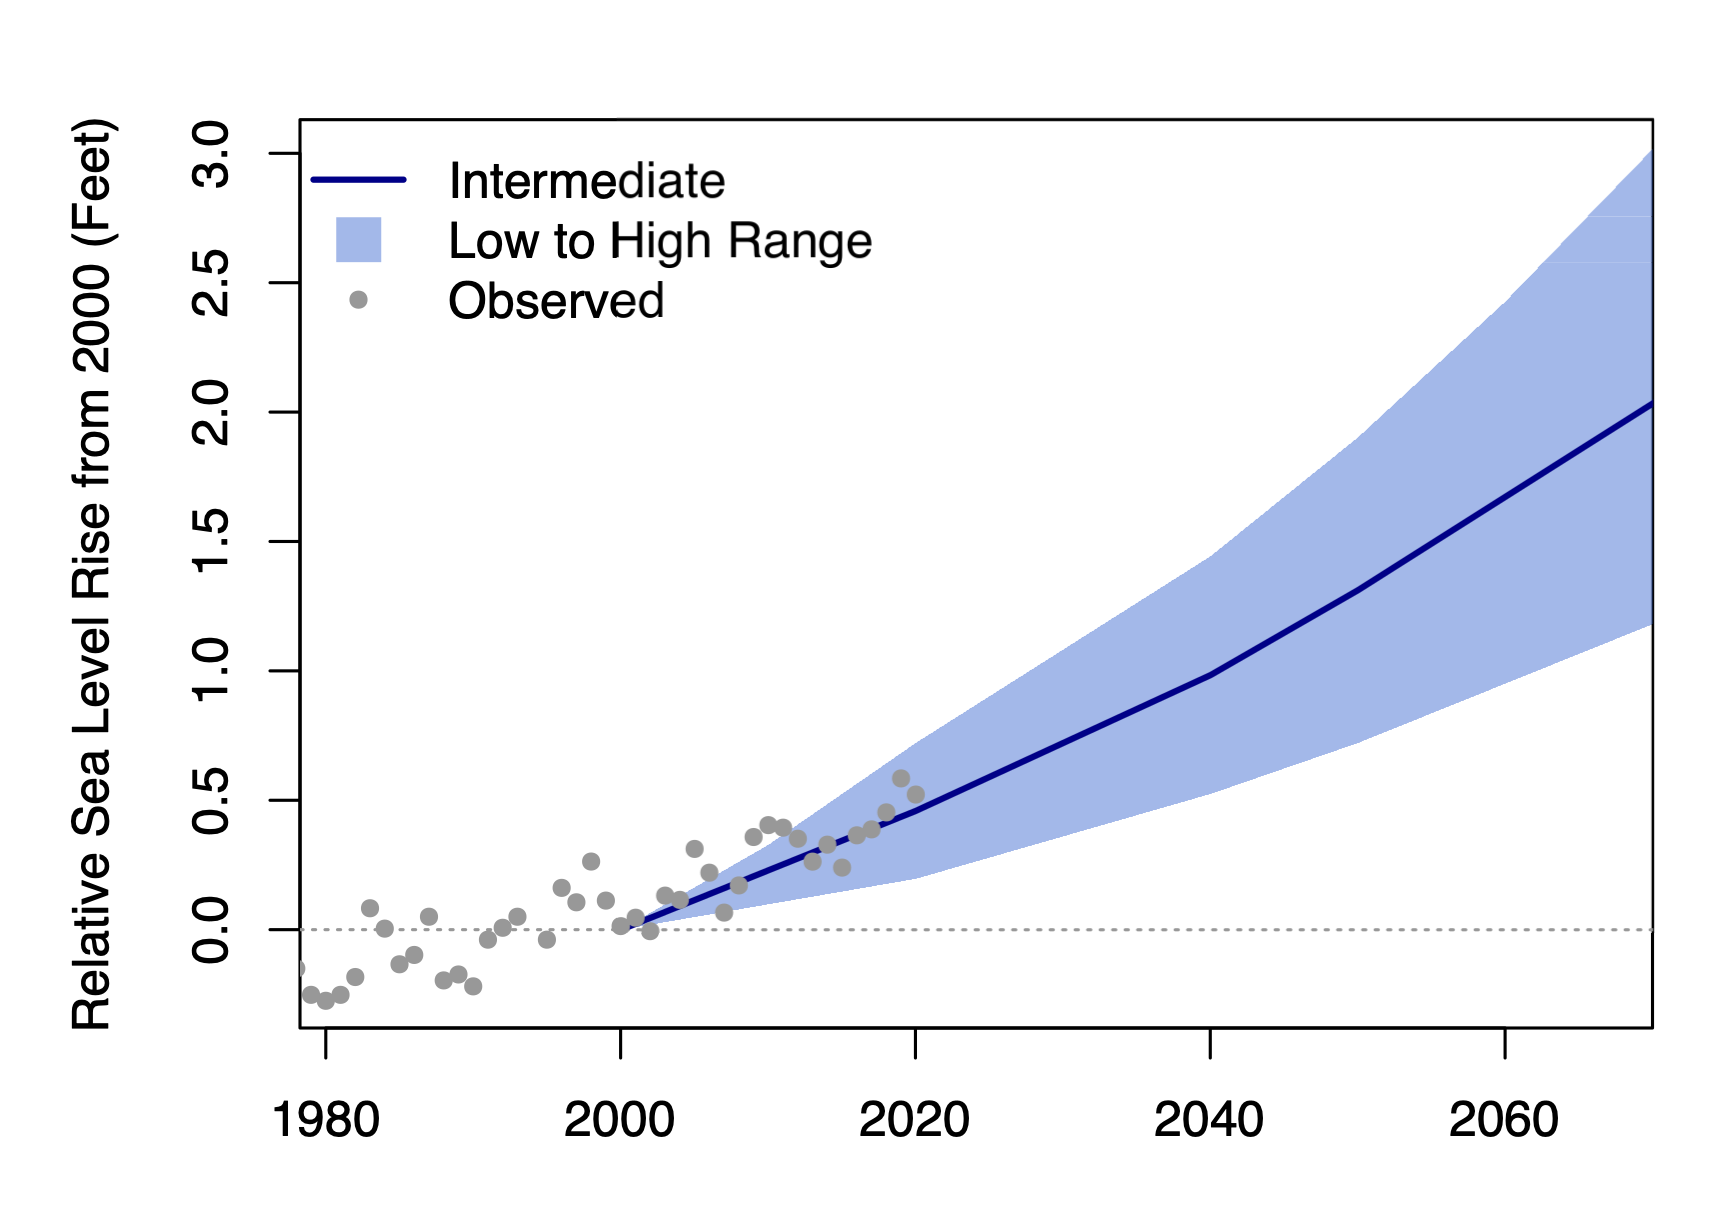
The graph shows the projected change of sea level in feet above mean sea level relative to 2000. The blue line shows the intermediate scenario (50% probability) and the blue shading shows the low to high scenario range (5 to 95% probability) of sea level rise used for official planning purposes in the state of Delaware. Dots show the observed changes in sea level in Lewes, DE. Data for the future scenarios are based on a high-emissions scenario (RCP 8.5).
Development of the Local Hazard Outlooks was supported by the National Oceanic and Atmospheric Administration (NOAA) grants NA18OAR4310302 and NA21OAR4310310.
v2.0-beta1 2025-06-04
Footnotes
Hindcasts are model results for a historical period. Hindcasts are useful for comparing observations with model estimates.↩︎