Delaware County, PA
Delaware County residents will face increasingly severe weather-related hazards, such as heat waves, flooding, and storm surge.
As the frequency and intensity of local hazards change, it is important for all of us to protect communities and local habitats. Using the best data, scientists can project how long-term averages in daily weather will change in the future, and the effects this will have on localities.
Information on extreme weather and hazards can empower citizens, decision-makers, and other stakeholders to make infored risk-reduction decisions. With planning and preparation, Delaware County can reduce risks for all residents.
Changing Temperature Patterns
Human health and infrastructure are all threatened by higher temperatures. At 95°F, it is hard to keep indoor areas and our bodies cool. Delaware County’s summers are getting hotter and this is intensified by the Heat Island effect1. On average, Delaware County sees 4 days per year with temperatures above 95°F (1990-2019 average). Within the next 50 years (by 2070), Delaware County can expect a yearly average of 23 to 41 days above 95°F, with associated increases in cooling costs, reduced air quality, and heat-related illnesses.
![]() HEAT-RELATED ILLNESSES: Heatwaves can kill people and pets. In Pennsylvania, more than 80 people have died from extreme heat between 2010 and 2019. Individuals at higher risk include children, pregnant women, older adults, outdoor workers, and lower-income residents.
HEAT-RELATED ILLNESSES: Heatwaves can kill people and pets. In Pennsylvania, more than 80 people have died from extreme heat between 2010 and 2019. Individuals at higher risk include children, pregnant women, older adults, outdoor workers, and lower-income residents.
![]() ENERGY USE: Heat islands increase the demand for air conditioning. In the US, electricity demand for cooling will increase by 5-20% for every added degree C. During heatwaves, increased demand can overload systems causing power companies to conduct rolling brownouts or blackouts to avoid system failure.
ENERGY USE: Heat islands increase the demand for air conditioning. In the US, electricity demand for cooling will increase by 5-20% for every added degree C. During heatwaves, increased demand can overload systems causing power companies to conduct rolling brownouts or blackouts to avoid system failure.
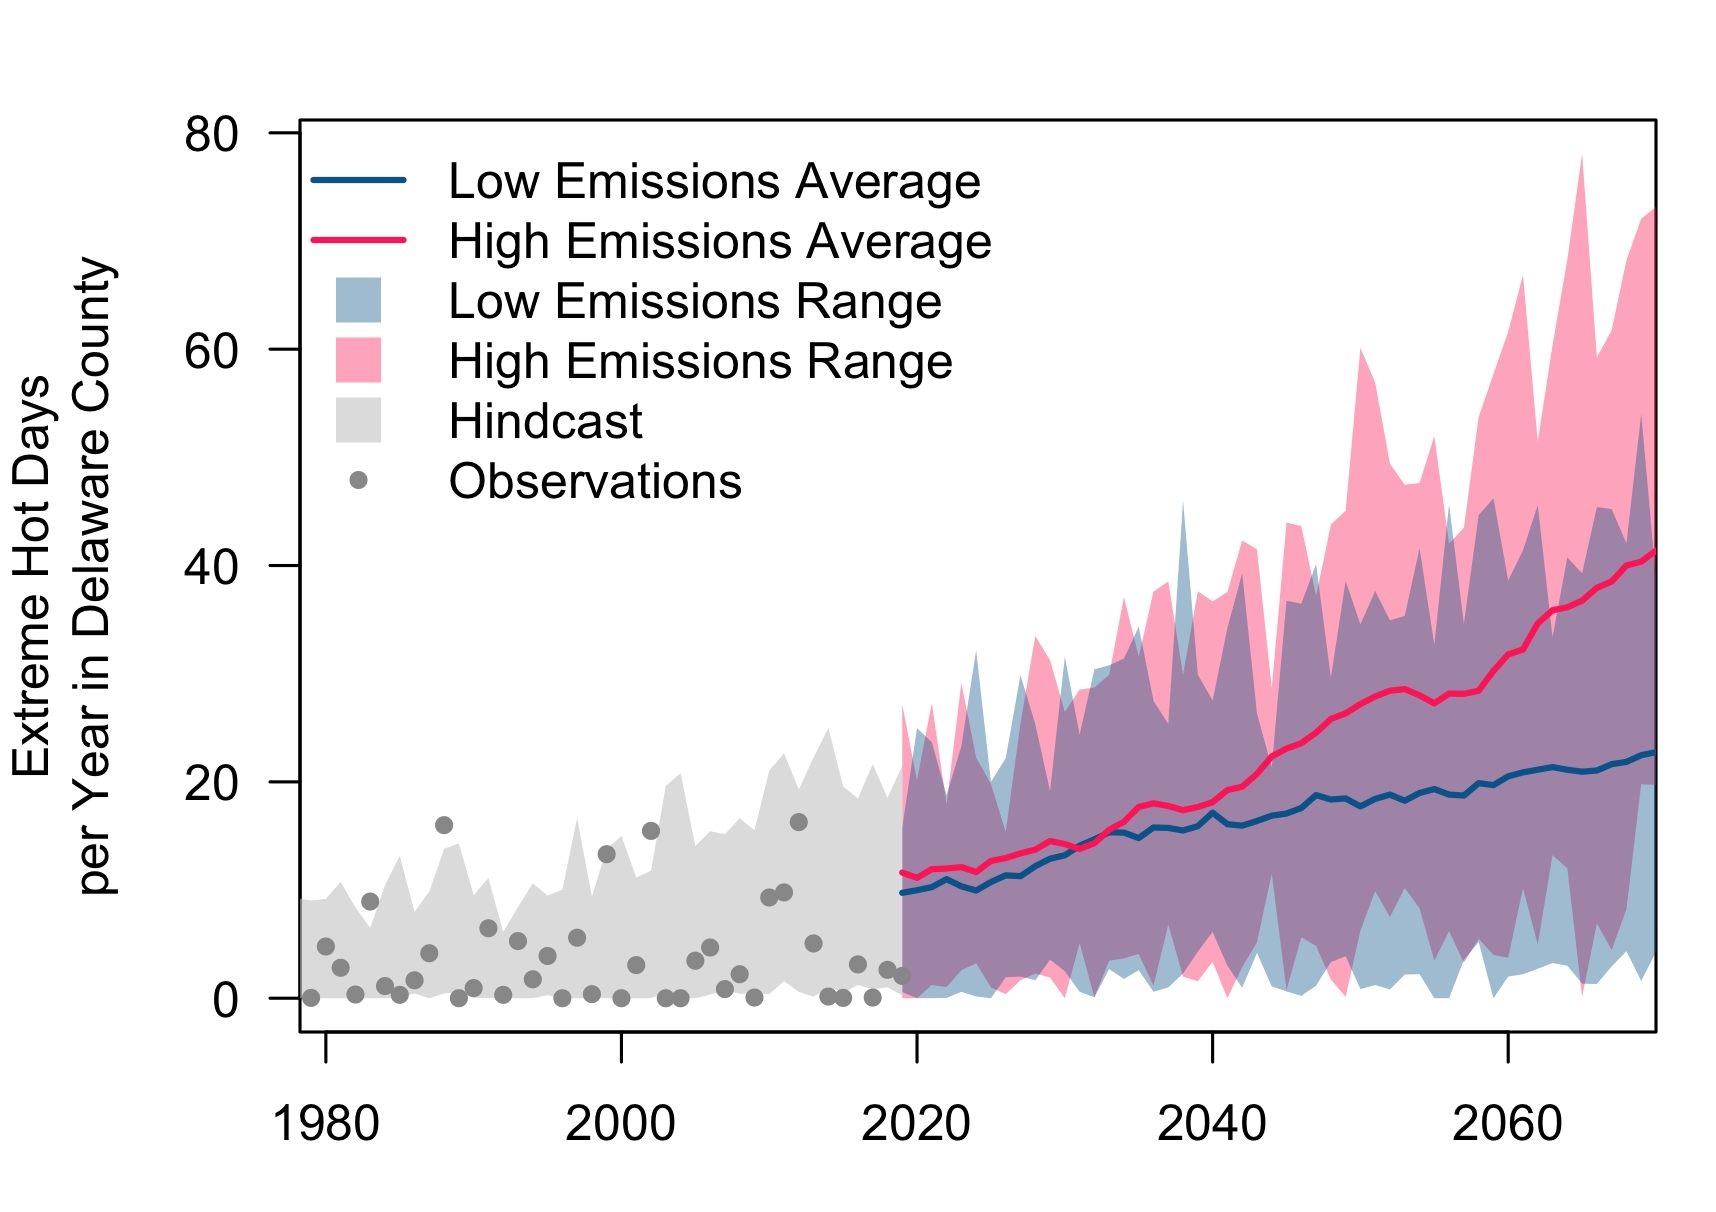
The graph shows the number of days in a year with temperatures above or equal to 95°F. Dots represent observed annual days of extreme temperatures and the gray shading shows the hindcast2. Two scenarios of the future are shown as a high-emissions scenario (RCP 8.5) in red and a low-emissions scenario (RCP 4.5) in blue. Data for the future scenarios are retrieved from Multivariate Adaptive Constructed Analogs (MACA), and observed data are from the Gridded Surface Meteorological Dataset (gridMET).
Changing Rainfall Patterns
Heavy rainfall in Delaware County is increasing in frequency and intensity, causing flash floods, property damage, septic backups, mold and indoor air quality issues, and impacts to water quality in the Delaware and Schuylkill Rivers. Annual rainfall in Delaware County will likely increase by an average of 2 to 3 inches (2050-2079 average compared to the 1990-2019 average).
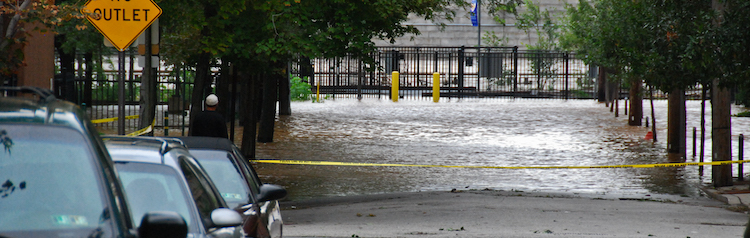
![]() FLOODING: High concentrations of pavement and infrastructure intensify flooding because they prevent rainwater from seeping into the ground. Heavy rain can quickly overwhelm infrastructure and drainage systems. It can quickly cover streets causing traffic to slow and become deadly to drivers.
FLOODING: High concentrations of pavement and infrastructure intensify flooding because they prevent rainwater from seeping into the ground. Heavy rain can quickly overwhelm infrastructure and drainage systems. It can quickly cover streets causing traffic to slow and become deadly to drivers.
![]() REDUCED HUMAN HEALTH: Changing moisture levels impact the spread of mold and illness, including tick- and mosquito-borne diseases as high humidity promote their reproduction and how far they can travel.
REDUCED HUMAN HEALTH: Changing moisture levels impact the spread of mold and illness, including tick- and mosquito-borne diseases as high humidity promote their reproduction and how far they can travel.
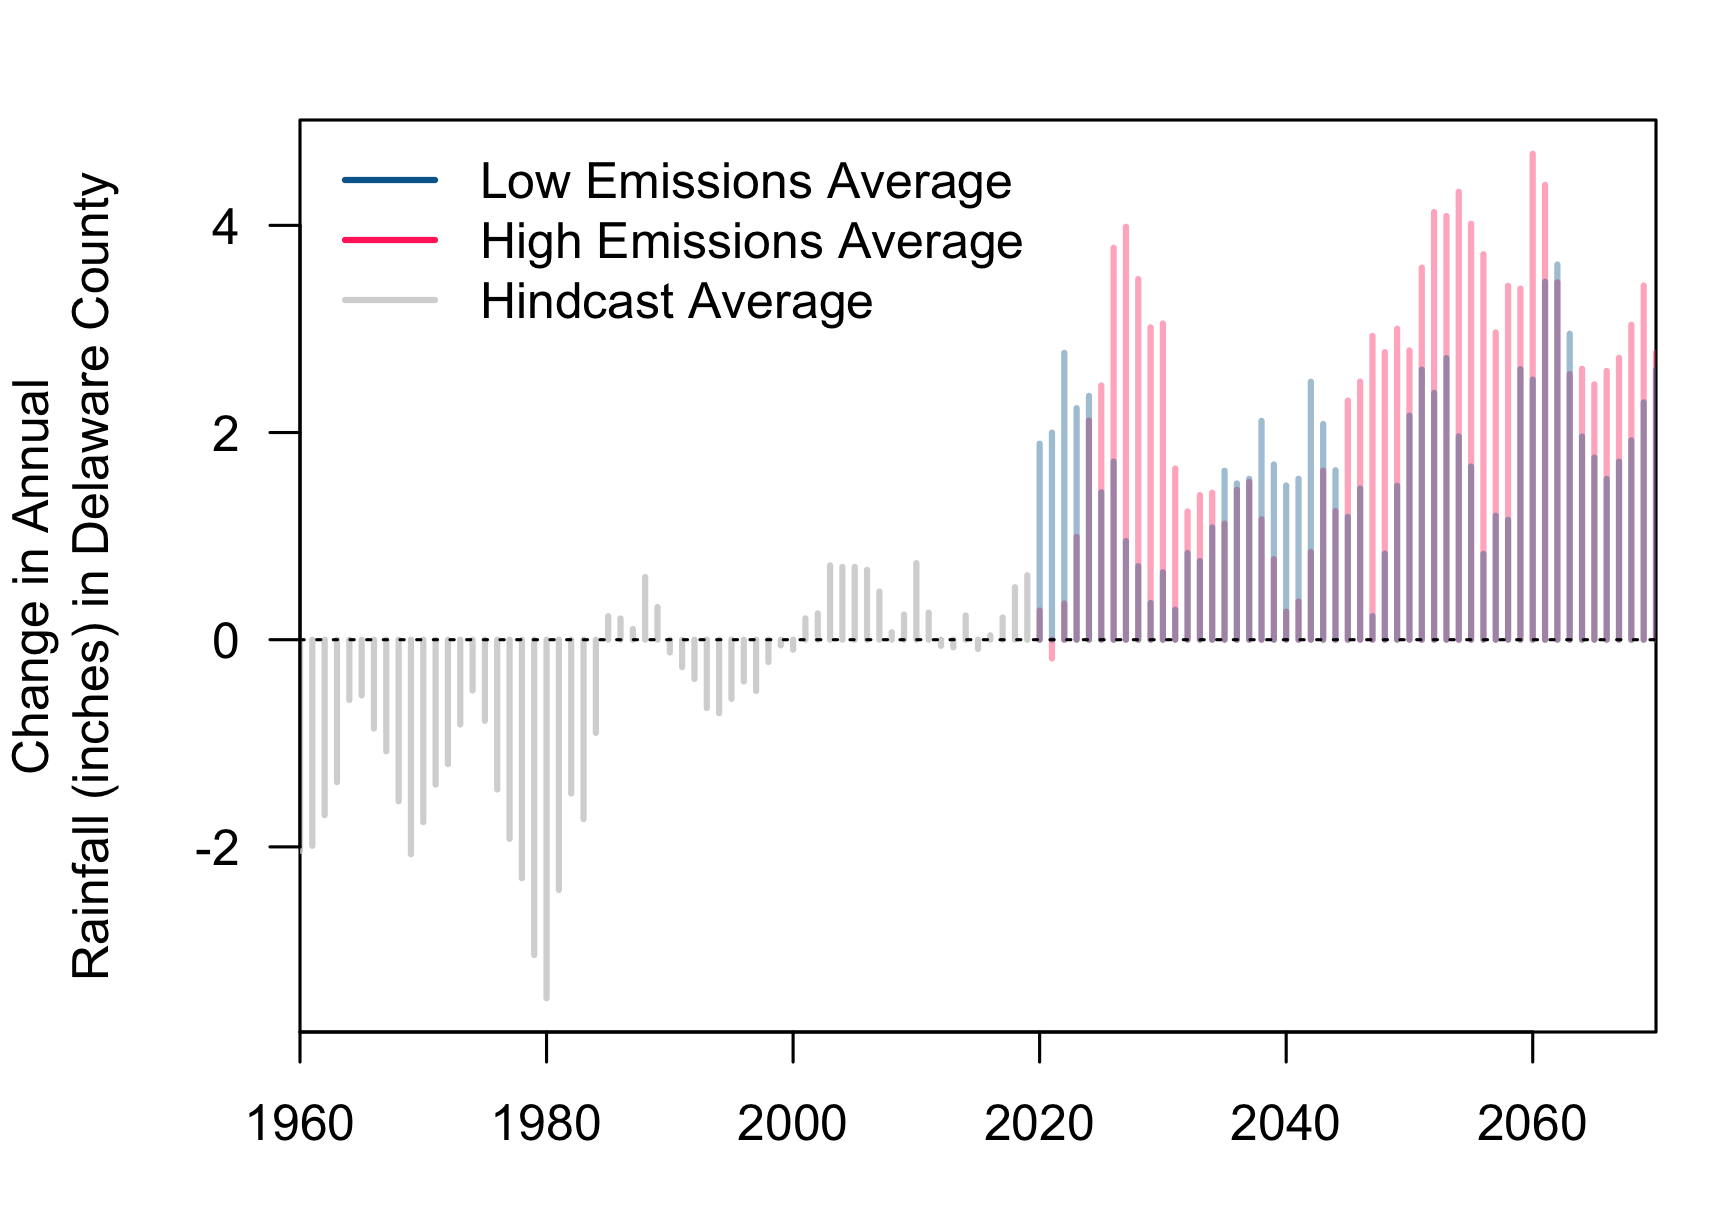
The graph shows the change in annual rainfall compared to the average between 1990 and 2019. The gray lines show the hindcast. Two scenarios of the future are shown as a high-emissions scenario (RCP 8.5) in red and a low-emissions scenario (RCP 4.5) in blue. Data for the future scenarios are retrieved from MACA.
Sea Level Rise
As temperatures warm, land ice melts and seawater expands causing sea levels to rise around the world and water levels to rise in the tidal Delaware and Schuylkill Rivers. Between 1950 and 2019, sea levels near Delaware County rose roughly 0.8 feet leading to more frequent and severe flooding. Water levels will rise 0.8 to 1.7 feet above the 2000-2004 average in the next 30 years (by the 2050s), submerging property, damaging infrastructure, and pushing the salt line upriver.
![]() FLOODING: Rising sea levels allow tides, waves, and severe flooding to push further upriver. This causes more frequent high tide flooding and increases the impacts of storm surge, putting low-lying housing, commercial property, and infrastructure at risk.
FLOODING: Rising sea levels allow tides, waves, and severe flooding to push further upriver. This causes more frequent high tide flooding and increases the impacts of storm surge, putting low-lying housing, commercial property, and infrastructure at risk.
![]() SALTWATER INTRUSION: As saltwater from sea level rise pushes further upstream, it threatens drinking water and stormwater infrastructure. Saltwater intrusion can force municipalities to abandon sources of drinking water and reduces the lifespan and performance of stormwater infrastructure.
SALTWATER INTRUSION: As saltwater from sea level rise pushes further upstream, it threatens drinking water and stormwater infrastructure. Saltwater intrusion can force municipalities to abandon sources of drinking water and reduces the lifespan and performance of stormwater infrastructure.
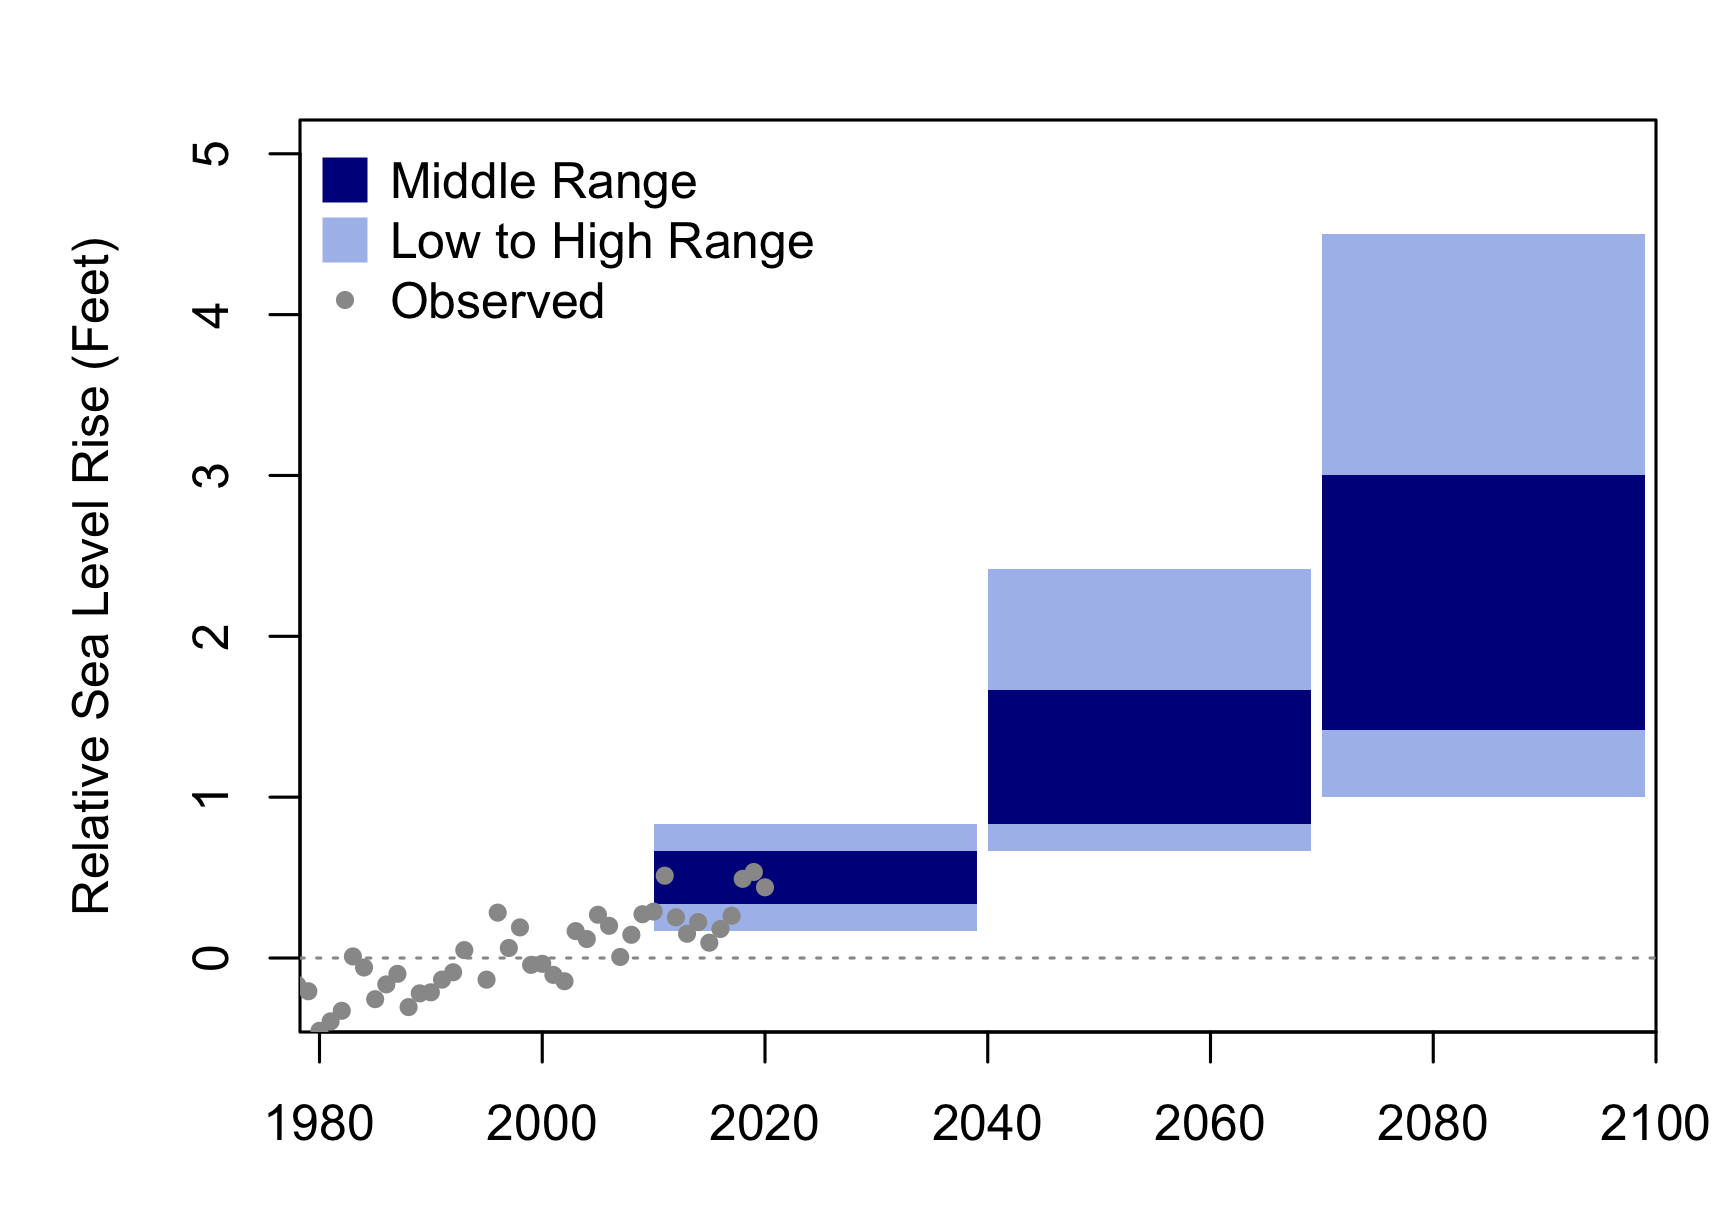
The graph shows the projected change of sea level in feet above mean sea level relative to the 2000-2004 average. The dark blue shading shows the middle range (25 to 75% probability) and the light blue shading shows the low to high range (10 to 90% probability) of sea level rise as 30-year averages that are used for official planning purposes in the Philadelphia region. Dots show the observed changes in water level in Philadelphia.
Development of the Local Hazard Outlooks was supported by the National Oceanic and Atmospheric Administration (NOAA) grants NA18OAR4310302 and NA21OAR4310310.
v2.0 2025-11-04