Martinsville, VA
Martinsville residents will face increasingly severe weather-related hazards, such as heat waves, flooding, and shifting seasons.
As the frequency and intensity of local hazards change, it is important for all of us to protect communities and local habitats. Using the best data, scientists can project how long-term averages in daily weather will change in the future, and the effects this will have on localities.
Information on extreme weather and hazards can empower citizens, decision-makers, and other stakeholders to make infored risk-reduction decisions. With planning and preparation, Martinsville can reduce risks for all residents.

Changing Temperature Patterns
Human health, stream and river health, and infrastructure are all threatened by higher temperatures. At 95°F, it is hard to keep indoor areas and our bodies cool. Martinsville’s summers are getting hotter and this is intensified by the Heat Island effect1. On average, Martinsville sees 4 days per year in excess of 95°F. Within the next 50 years (by 2070), Martinsville can expect a yearly average of 28 to 52 days above 95°F, with associated increases in cooling costs, reduced air quality, and heat-related illnesses.
![]() HEAT-RELATED ILLNESSES: Heatwaves can kill people and pets. More than 100 Virginians have died from extreme heat between 2010 and 2019. Individuals at higher risk include children, pregnant women, older adults, outdoor workers, and lower-income residents.
HEAT-RELATED ILLNESSES: Heatwaves can kill people and pets. More than 100 Virginians have died from extreme heat between 2010 and 2019. Individuals at higher risk include children, pregnant women, older adults, outdoor workers, and lower-income residents.
![]() ENERGY USE: Heat islands increase the demand for air conditioning. In the US, electricity demand for cooling will increase by 5-20% for every added degree C. During heatwaves, increased demand can overload systems causing power companies to conduct rolling brownouts or blackouts to avoid system failure.
ENERGY USE: Heat islands increase the demand for air conditioning. In the US, electricity demand for cooling will increase by 5-20% for every added degree C. During heatwaves, increased demand can overload systems causing power companies to conduct rolling brownouts or blackouts to avoid system failure.
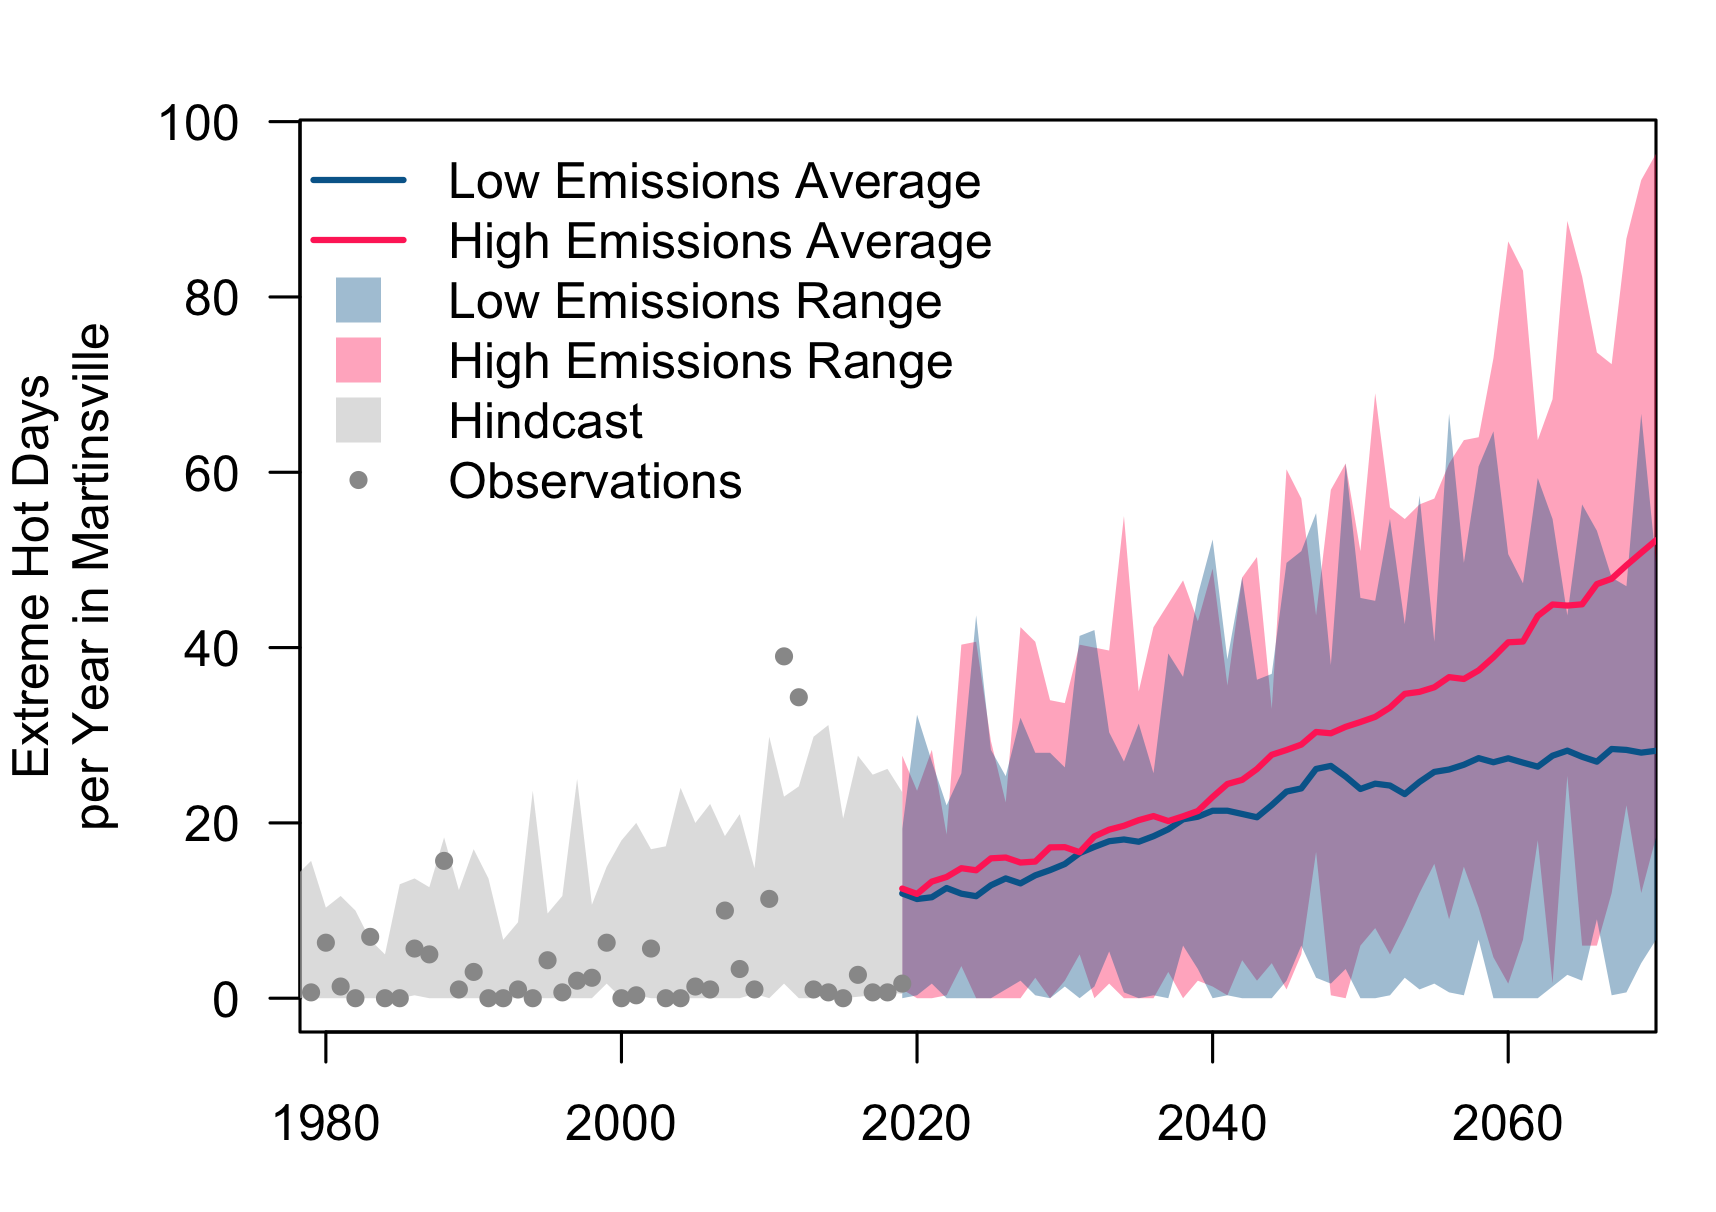
The graph shows the number of days in a year with temperatures above or equal to 95°F. Dots represent observed annual days of extreme temperatures and the gray shading shows the hindcast2. Two scenarios of the future are shown as a high-emissions scenario (RCP 8.5) in red and a low-emissions scenario (RCP 4.5) in blue. Data for the future scenarios are retrieved from Multivariate Adaptive Constructed Analogs (MACA), and observed data are from the Gridded Surface Meteorological Dataset (gridMET).
Changing Rainfall Patterns
Heavy rainfall in Martinsville is increasing in frequency and intensity, causing property damage, septic backups, well contamination, mold and indoor air quality issues, and impacts to water quality in local streams and the Chesapeake Bay. Annual rainfall in Martinsville will likely increase by an average of 2 to 3 inches (2050-2079 average compared to the 1990-2019 average).
![]() FLOODING: Heavy rain overwhelms infrastructure and drainage systems, causing property damage and covering roads.
FLOODING: Heavy rain overwhelms infrastructure and drainage systems, causing property damage and covering roads.
![]() REDUCED HUMAN HEALTH: Changing moisture levels impact the spread of mold and illness, including tick- and mosquito-borne diseases. High humidity allows ticks to travel further and promotes mold growth. Flooded areas from rainfall promote mosquito reproduction leading to more mosquitoes.
REDUCED HUMAN HEALTH: Changing moisture levels impact the spread of mold and illness, including tick- and mosquito-borne diseases. High humidity allows ticks to travel further and promotes mold growth. Flooded areas from rainfall promote mosquito reproduction leading to more mosquitoes.
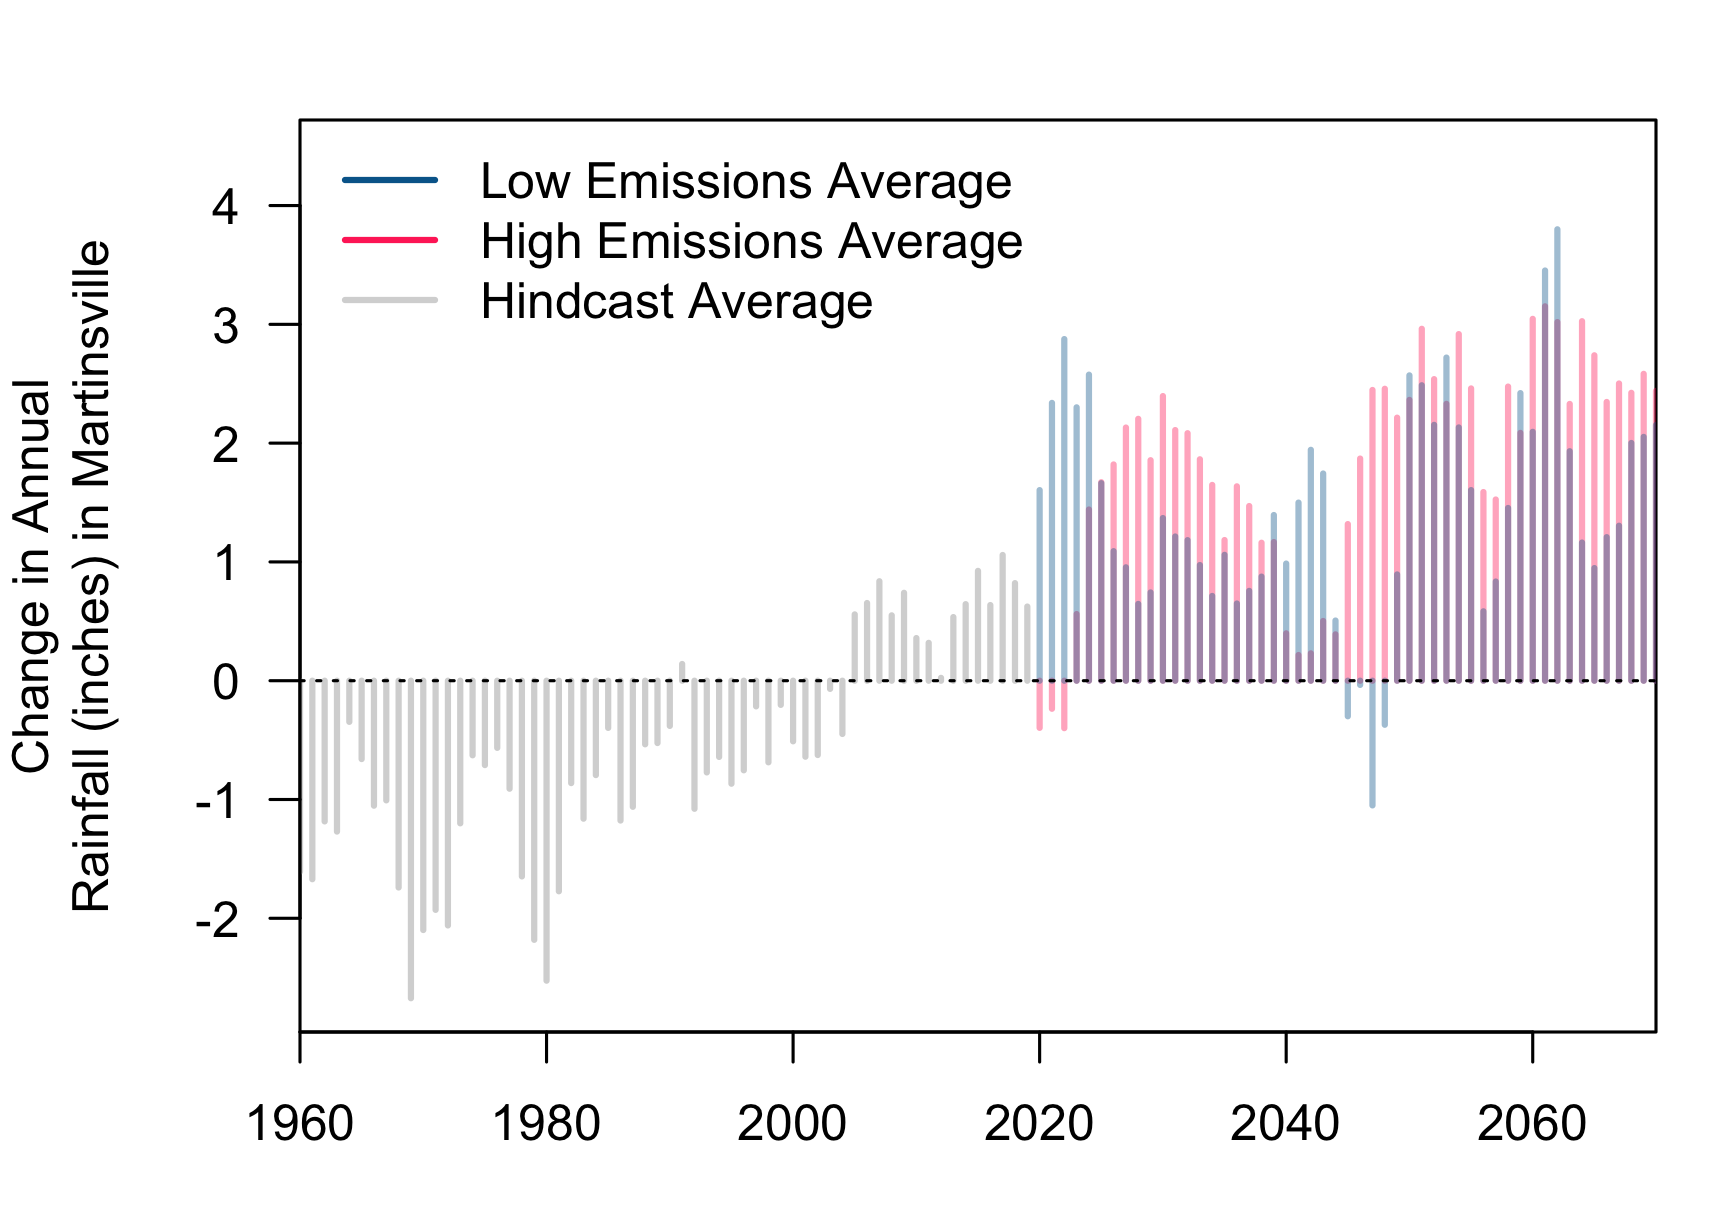
The graph shows the change in annual rainfall compared to the average between 1990 and 2019. The gray lines show the hindcast. Two scenarios of the future are shown as a high-emissions scenario (RCP 8.5) in red and a low-emissions scenario (RCP 4.5) in blue. Data for the future scenarios are retrieved from MACA.
Shifting Seasons
Seasons are changing in length and timing in Martinsville with an earlier spring, delay of fall, and shorter winter. While a longer frost-free period can benefit some crops or allow for double cropping, it can limit plant diversity, encourage invasive species, and threaten human and ecosystem health. Within the next 50 years (by 2070), the frost-free period will average 3 to 5 weeks longer in Martinsville.
![]() REDUCED HUMAN HEALTH: Milder winters help more ticks and mosquitos survive the winter and earlier springs make their biting season longer. Earlier springs also cause trees and flowers to bloom earlier leading to a longer allergy season.
REDUCED HUMAN HEALTH: Milder winters help more ticks and mosquitos survive the winter and earlier springs make their biting season longer. Earlier springs also cause trees and flowers to bloom earlier leading to a longer allergy season.
![]() FALSE SPRINGS: A false spring is a period of warm weather in late winter or early spring that causes plants to grow too early leaving gardens exposed to frost. It can cause early migration of waterfowl and songbirds leading them to miss out on key food for reproduction. Reduced snow cover from mild winters impacts winter sports and helps cause drought, increasing fire risk and water restrictions.
FALSE SPRINGS: A false spring is a period of warm weather in late winter or early spring that causes plants to grow too early leaving gardens exposed to frost. It can cause early migration of waterfowl and songbirds leading them to miss out on key food for reproduction. Reduced snow cover from mild winters impacts winter sports and helps cause drought, increasing fire risk and water restrictions.
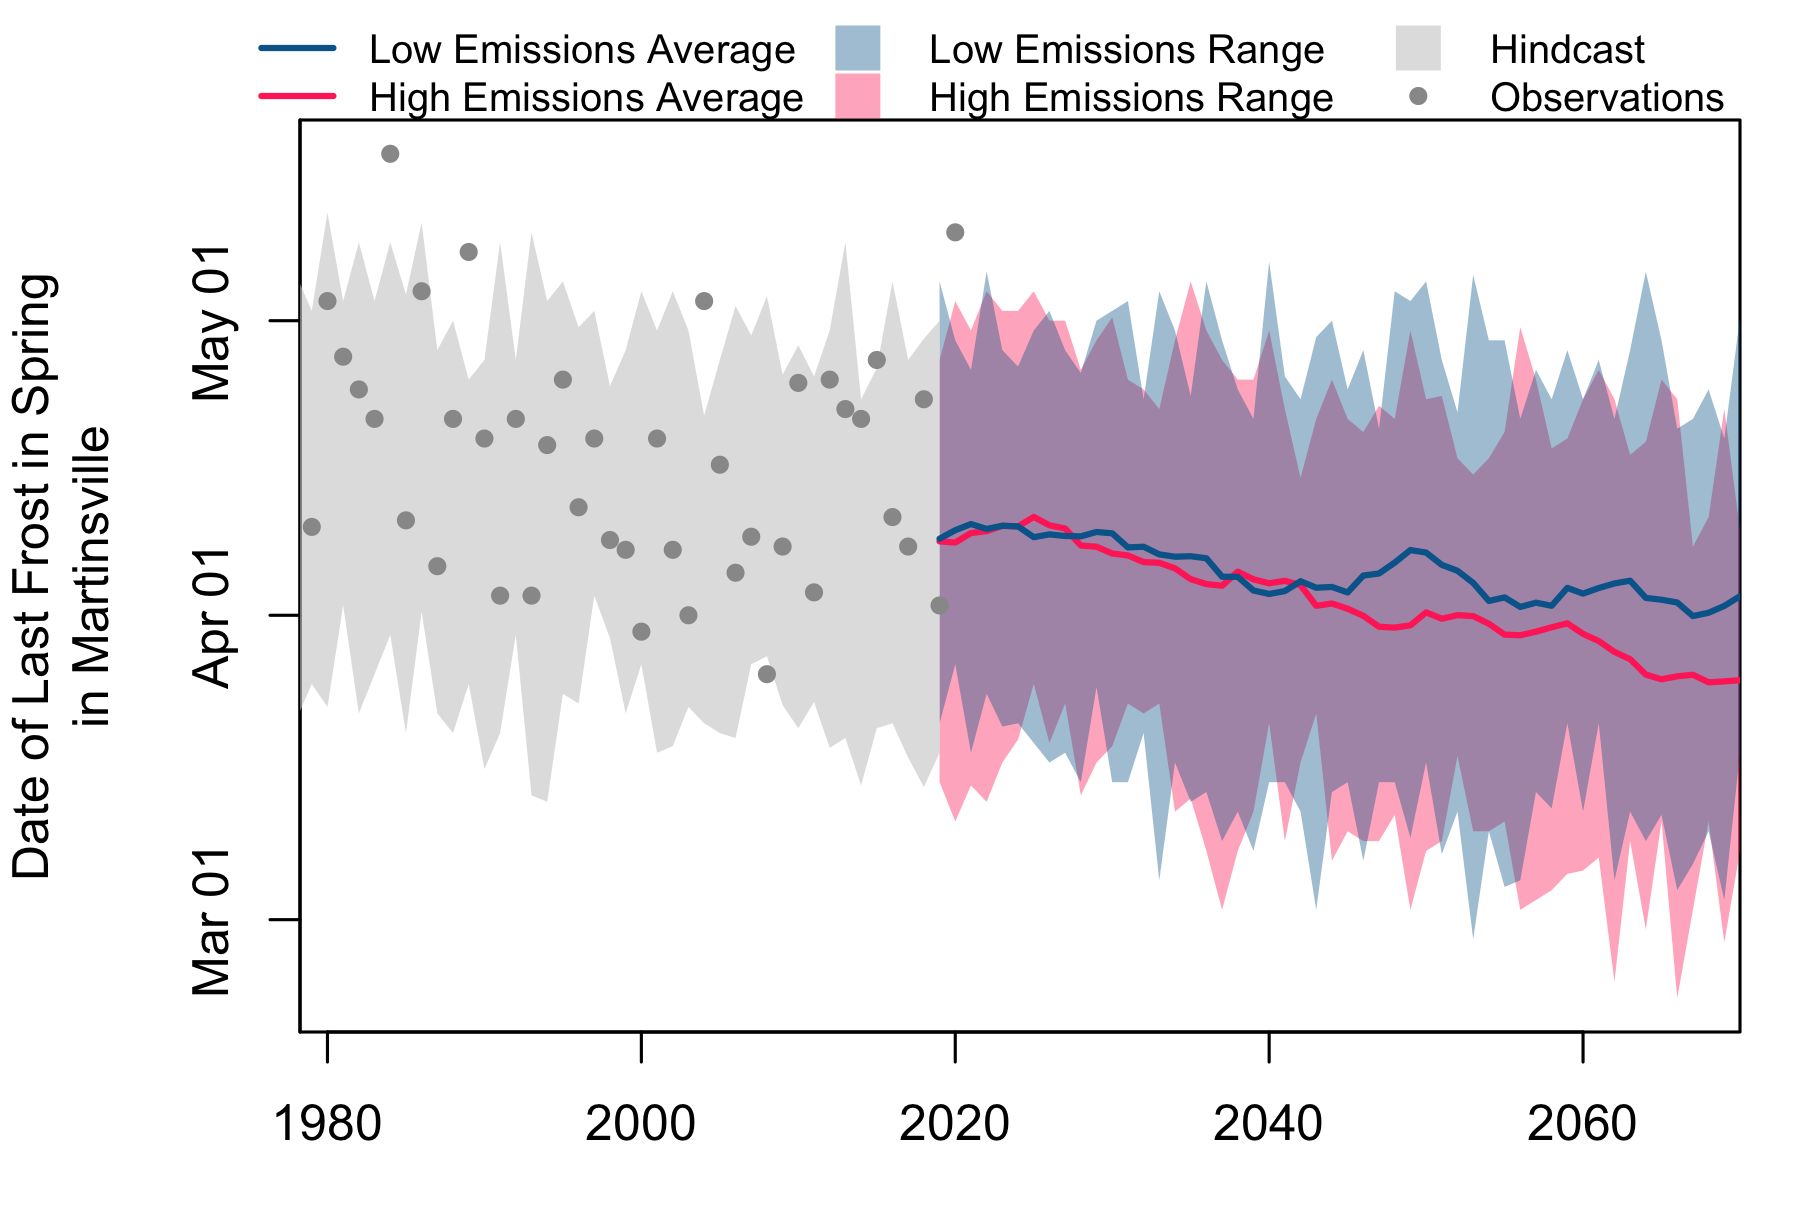
The graph shows the date of the last frost (less than or equal to 32°F) in spring. Dots represent observed dates of the last frost in spring and the gray shading shows the hindcast. Two scenarios of the future are shown as a high-emissions scenario (RCP 8.5) in red and a low-emissions scenario (RCP 4.5) in blue. Data for the future scenarios are retrieved from Multivariate Adaptive Constructed Analogs (MACA), and observed data are from the Gridded Surface Meteorological Dataset (gridMET).
Development of the Local Hazard Outlooks was supported by the National Oceanic and Atmospheric Administration (NOAA) grants NA18OAR4310302 and NA21OAR4310310.
v2.0-beta1 2025-06-04