Henrico County, VA
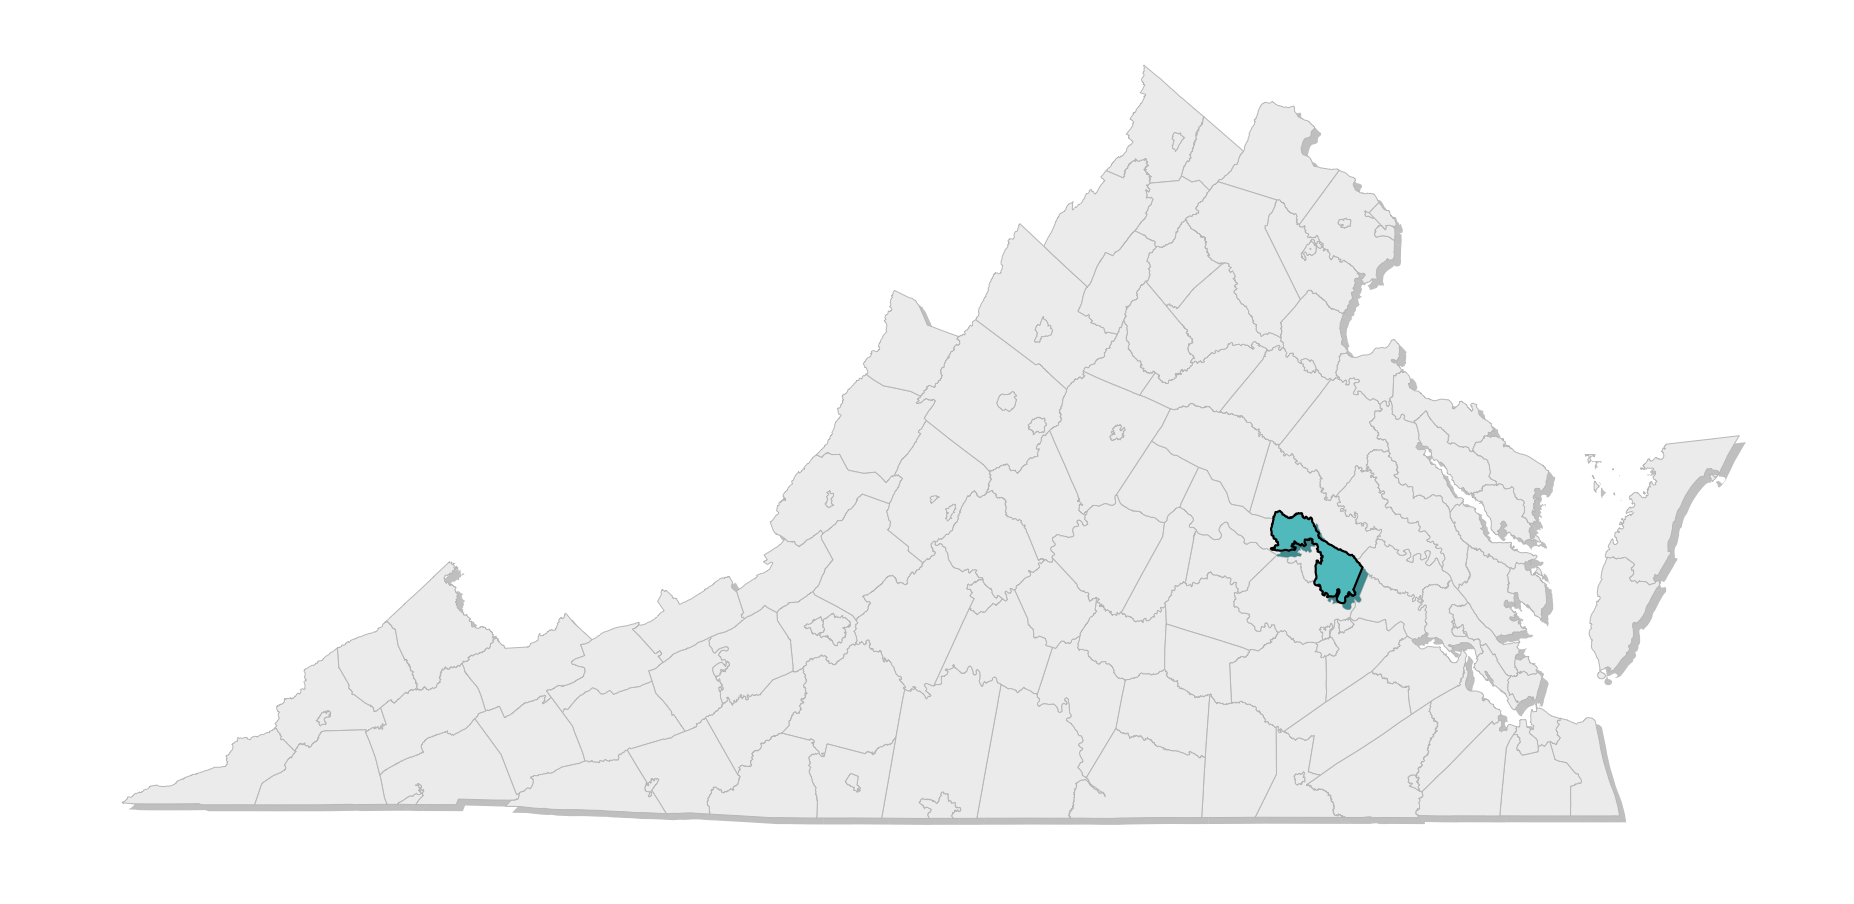
Henrico County residents will face increasingly severe weather-related hazards, such as heat waves, flooding, and storm surge.
As the frequency and intensity of local hazards change, it is important for all of us to protect communities and local habitats. Using the best data, scientists can project how long-term averages in daily weather will change in the future, and the effects this will have on localities.
Information on extreme weather and hazards can empower citizens, decision-makers, and other stakeholders to make infored risk-reduction decisions. With planning and preparation, Henrico County can reduce risks for all residents.
Changing Temperature Patterns
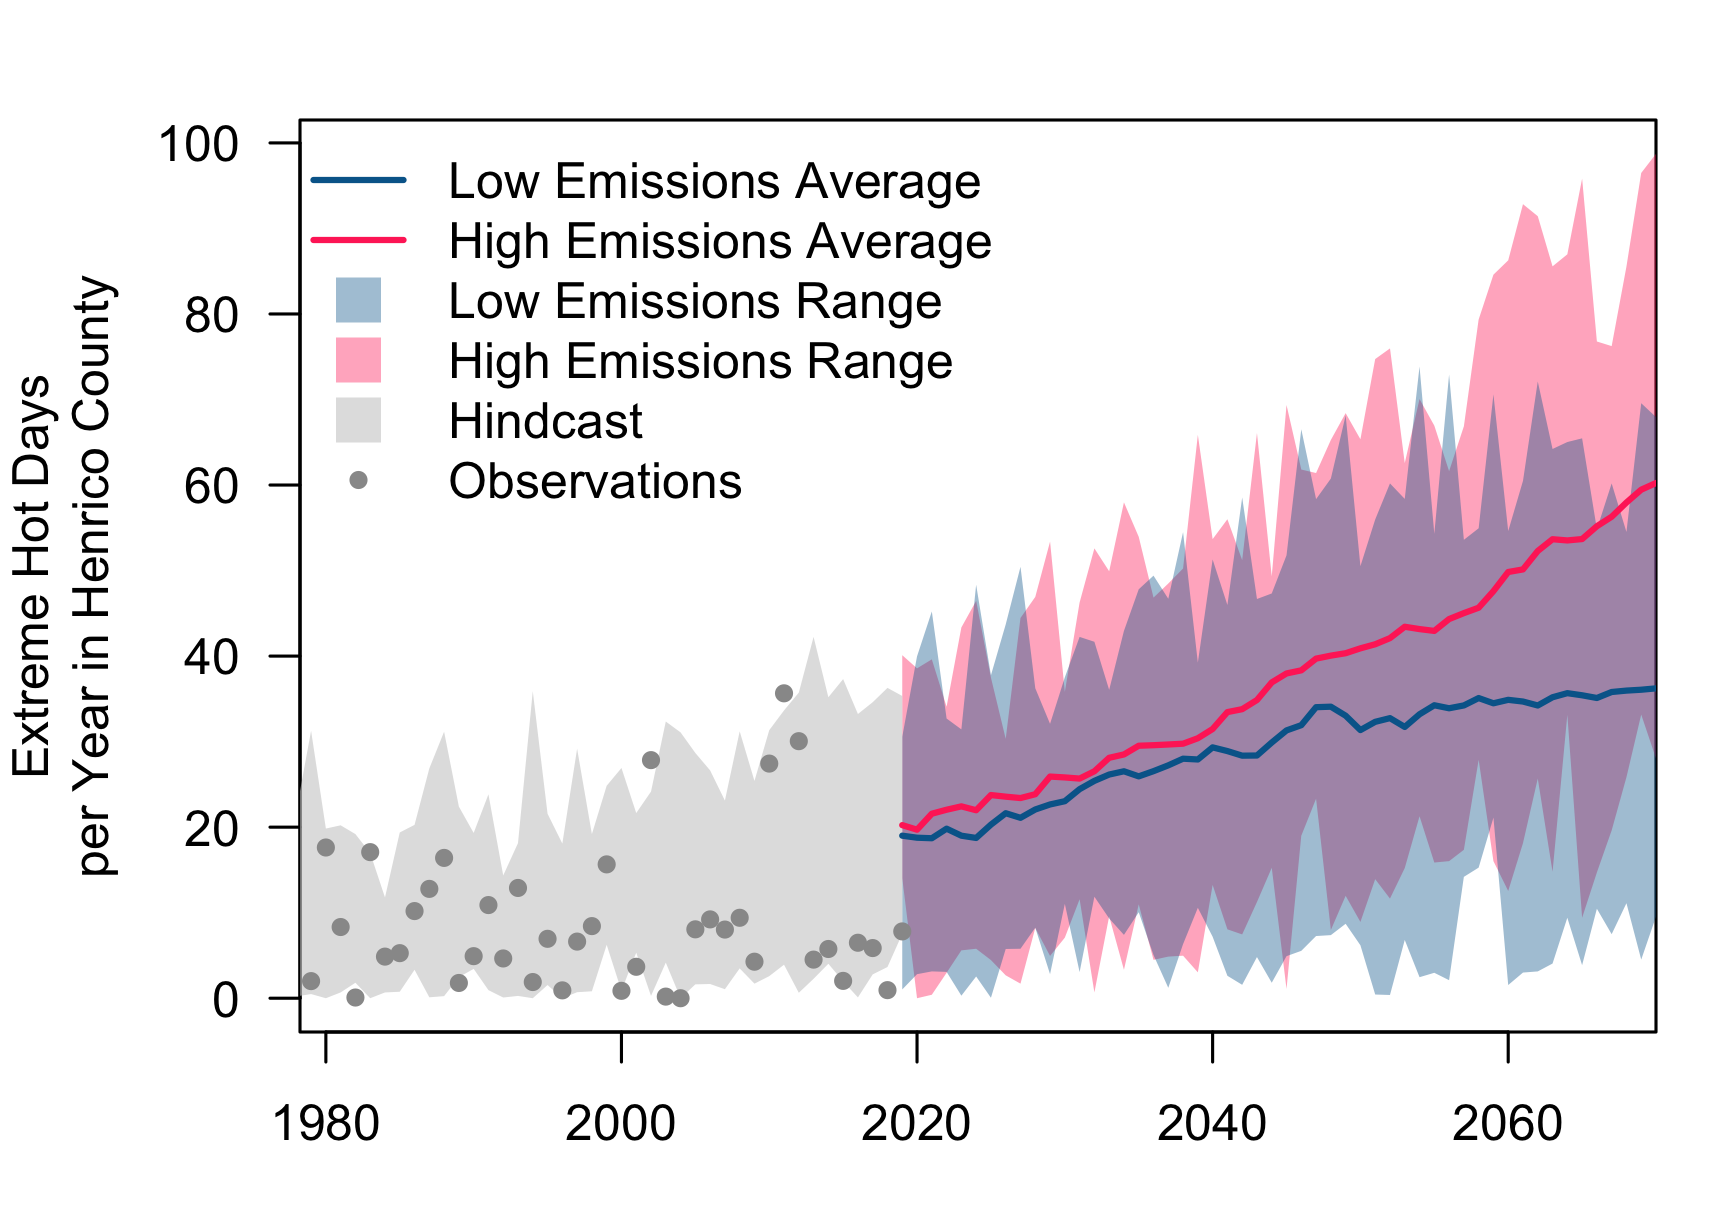
Human health, local fisheries, and infrastructure are all threatened by higher temperatures. At 95°F, it is hard to keep indoor areas and our bodies cool. Henrico County’s summers are getting hotter and this is intensified by the Heat Island effect1. On average, Henrico County sees 9 days per year with temperatures above 95°F (1990-2019 average). Within the next 50 years (by 2070), Henrico County can expect a yearly average of 36 to 60 days above 95°F, with associated increases in cooling costs, reduced air quality, and heat-related illnesses.
![]() HEAT-RELATED ILLNESSES: Heatwaves can kill people and pets. More than 100 Virginians have died from extreme heat between 2010 and 2019. Individuals at higher risk include children, pregnant women, older adults, outdoor workers, and lower-income residents.
HEAT-RELATED ILLNESSES: Heatwaves can kill people and pets. More than 100 Virginians have died from extreme heat between 2010 and 2019. Individuals at higher risk include children, pregnant women, older adults, outdoor workers, and lower-income residents.
![]() ENERGY USE: Heat islands increase the demand for air conditioning. In the US, electricity demand for cooling will increase by 5-20% for every added degree C. During heatwaves, increased demand can overload systems causing power companies to conduct rolling brownouts or blackouts to avoid system failure.
ENERGY USE: Heat islands increase the demand for air conditioning. In the US, electricity demand for cooling will increase by 5-20% for every added degree C. During heatwaves, increased demand can overload systems causing power companies to conduct rolling brownouts or blackouts to avoid system failure.
The graph shows the number of days in a year with temperatures above or equal to 95°F. Dots represent observed annual days of extreme temperatures and the gray shading shows the hindcast2. Two scenarios of the future are shown as a high-emissions scenario (RCP 8.5) in red and a low-emissions scenario (RCP 4.5) in blue. Data for the future scenarios are retrieved from Multivariate Adaptive Constructed Analogs (MACA), and observed data are from the Gridded Surface Meteorological Dataset (gridMET).
Changing Rainfall Patterns
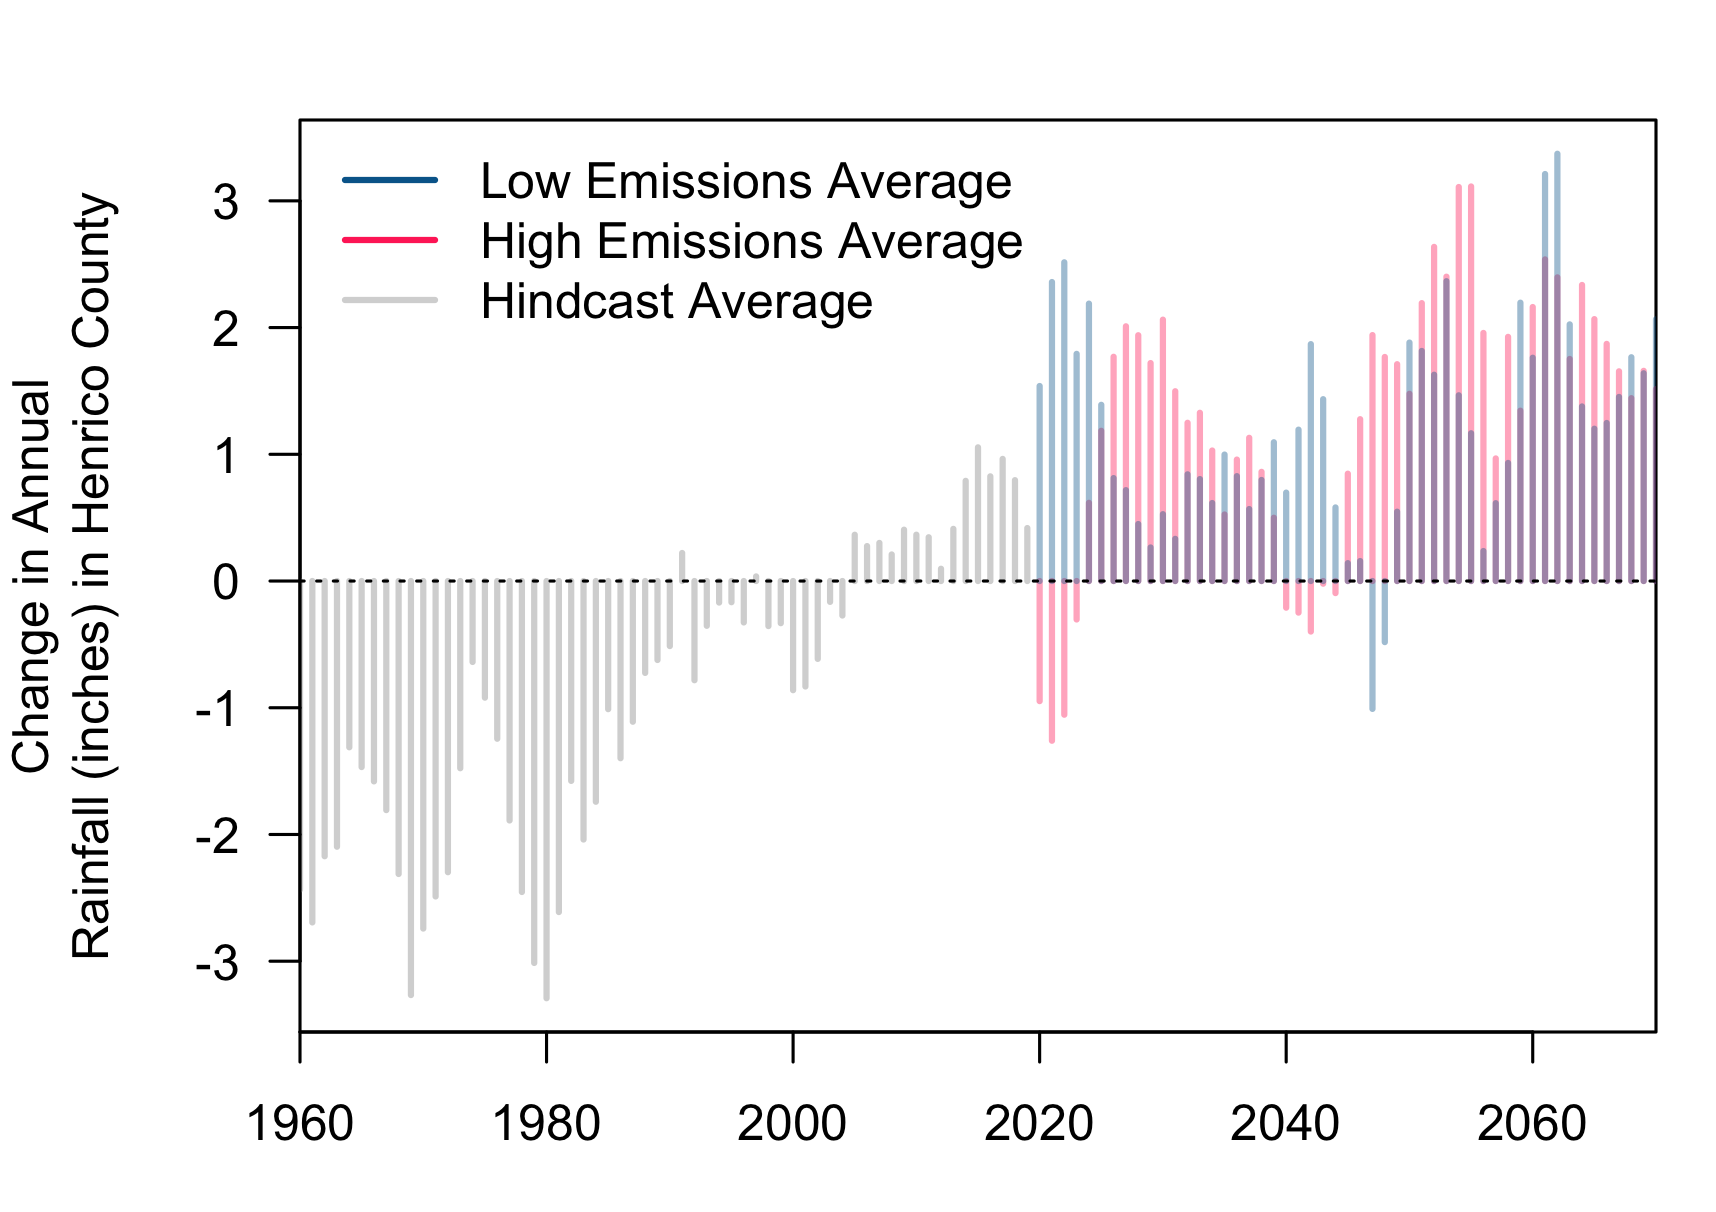
Heavy rainfall in Henrico County is increasing in frequency and intensity, causing property damage, septic backups, and impacts to water quality in wells, local streams, mold and indoor air quality issues, and the Chesapeake Bay. Annual rainfall in Henrico County will likely increase by an average of 2 inches (2050-2079 average compared to the 1990-2019 average).
![]() FLOODING: Heavy rain overwhelms infrastructure and drainage systems, causing property damage and covering roads.
FLOODING: Heavy rain overwhelms infrastructure and drainage systems, causing property damage and covering roads.
![]() REDUCED HUMAN HEALTH: Changing moisture levels impact the spread of mold and illness, including tick- and mosquito-borne diseases. High humidity allows ticks to travel further and promotes mold growth. Flooded areas from rainfall promote mosquito reproduction leading to more mosquitoes.
REDUCED HUMAN HEALTH: Changing moisture levels impact the spread of mold and illness, including tick- and mosquito-borne diseases. High humidity allows ticks to travel further and promotes mold growth. Flooded areas from rainfall promote mosquito reproduction leading to more mosquitoes.
The graph shows the change in annual rainfall compared to the average between 1990 and 2019. The gray lines show the hindcast. Two scenarios of the future are shown as a high-emissions scenario (RCP 8.5) in red and a low-emissions scenario (RCP 4.5) in blue. Data for the future scenarios are retrieved from MACA.
Sea Level Rise
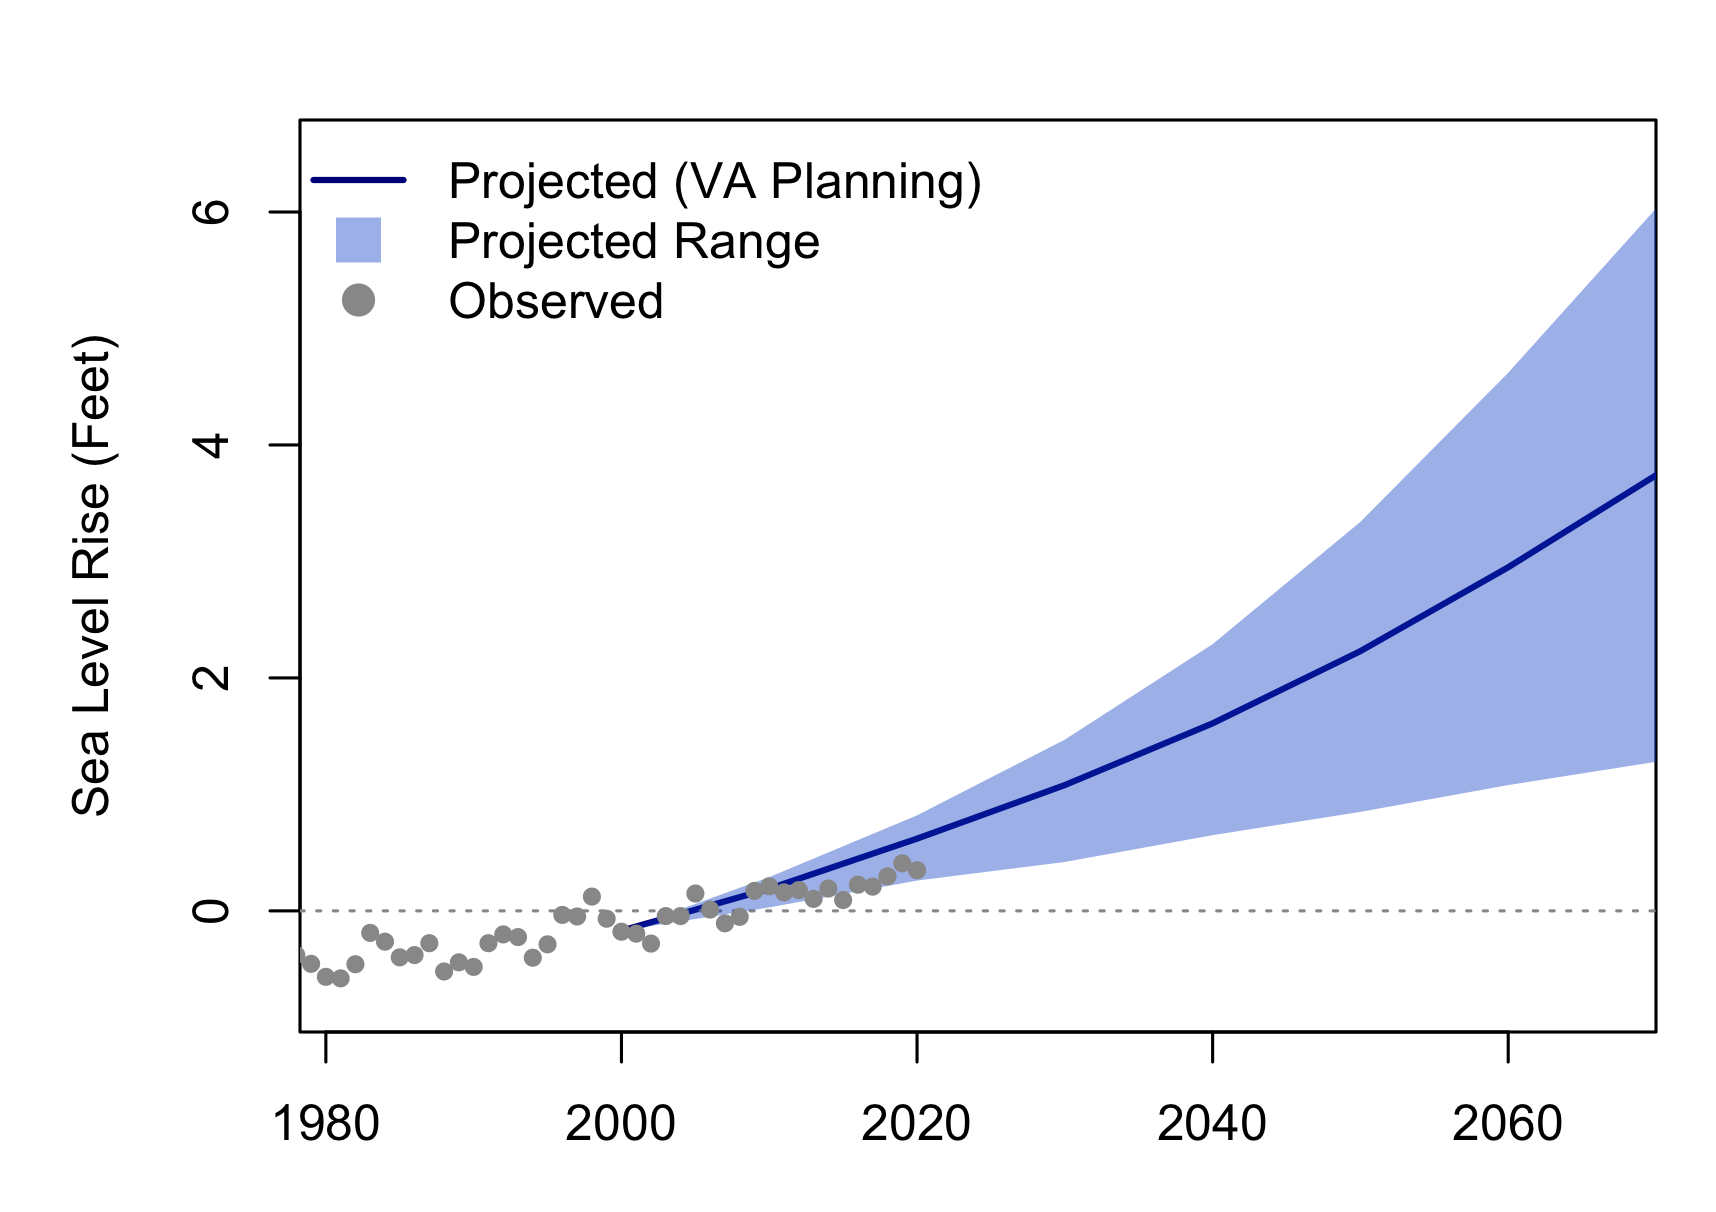
As temperatures warm, land ice melts and seawater expands causing sea levels to rise around the world. Between 1950 and 2019, sea levels in Virginia rose roughly 1 foot leading to more frequent and severe coastal flooding, and property damage. Sea levels will rise an additional 1 to 6 feet in the next 50 years (by 2070), submerging property and permanently reshaping Henrico County’s coastline.
![]() STORM SURGE: Rising sea levels increase the impacts of storm surge allowing waves and severe flooding to reach further inland. Storm surge can damage properties and coastal habitats, erode beaches, and cause serious injury or death.
STORM SURGE: Rising sea levels increase the impacts of storm surge allowing waves and severe flooding to reach further inland. Storm surge can damage properties and coastal habitats, erode beaches, and cause serious injury or death.
![]() TIDAL FLOODING: Rising sea levels allow tides to push further inland causing more frequent high tide flooding, putting low-lying housing, commercial property, and infrastructure at risk. Repeated tidal flooding disrupts everyday life by closing roads and overwhelming storm drains.
TIDAL FLOODING: Rising sea levels allow tides to push further inland causing more frequent high tide flooding, putting low-lying housing, commercial property, and infrastructure at risk. Repeated tidal flooding disrupts everyday life by closing roads and overwhelming storm drains.
The graph shows the projected change of sea level in feet above NAVD88 compared to the 1983-2001 average. The blue line shows the sea level rise scenario used for official planning purposes in Virginia. The blue shading shows the range between the low and extreme scenarios for sea level rise. Dots show the observed changes in sea level at Sewell’s Point, VA. Data for the future scenarios are retrieved from the National Oceanic and Atmospheric Administration (NOAA).
Development of the Local Hazard Outlooks was supported by the National Oceanic and Atmospheric Administration (NOAA) grants NA18OAR4310302 and NA21OAR4310310.
v2.0-beta1 2025-06-04